 By the way, I am out of AAPL completely after the breakdown today and yesterday. It failed to hold at the lower end of the symetrical triangle I mentioned before and apeared poised to break 60 (which it did) so I am out. There is a potential double bottom forming, but I am staying away from this one until it can show more strength and regain it's 200dma. If it breaks last month's low I could even go short.
Wednesday, May 31, 2006
DRIV is Cracking
DRIV apears to be in the early stages of a breakdown. It closed below it's 50 dma for the first time in about 4 months yesterday then broke out of its recent range today. The RSI is confirming an end to the uptrend, CCI is decidedly bearish and the MACD is about to go under. There may be a few more days of stalling in the lower end of it's recent range before making the first major leg down. As you can see from the chart there is alot of room to fall with no major consolidations in the last run up. A good target is the 68% fib retracement which lies near a high volume move and the 200 dma around 36. DRIV is currently IBD's # 41, lets see how far it falls in next monday's paper.
 By the way, I am out of AAPL completely after the breakdown today and yesterday. It failed to hold at the lower end of the symetrical triangle I mentioned before and apeared poised to break 60 (which it did) so I am out. There is a potential double bottom forming, but I am staying away from this one until it can show more strength and regain it's 200dma. If it breaks last month's low I could even go short.
By the way, I am out of AAPL completely after the breakdown today and yesterday. It failed to hold at the lower end of the symetrical triangle I mentioned before and apeared poised to break 60 (which it did) so I am out. There is a potential double bottom forming, but I am staying away from this one until it can show more strength and regain it's 200dma. If it breaks last month's low I could even go short.
Tuesday, May 30, 2006
Climax tops and SUPX
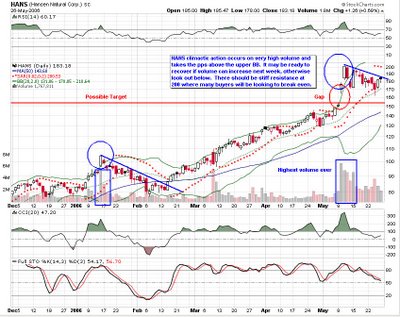
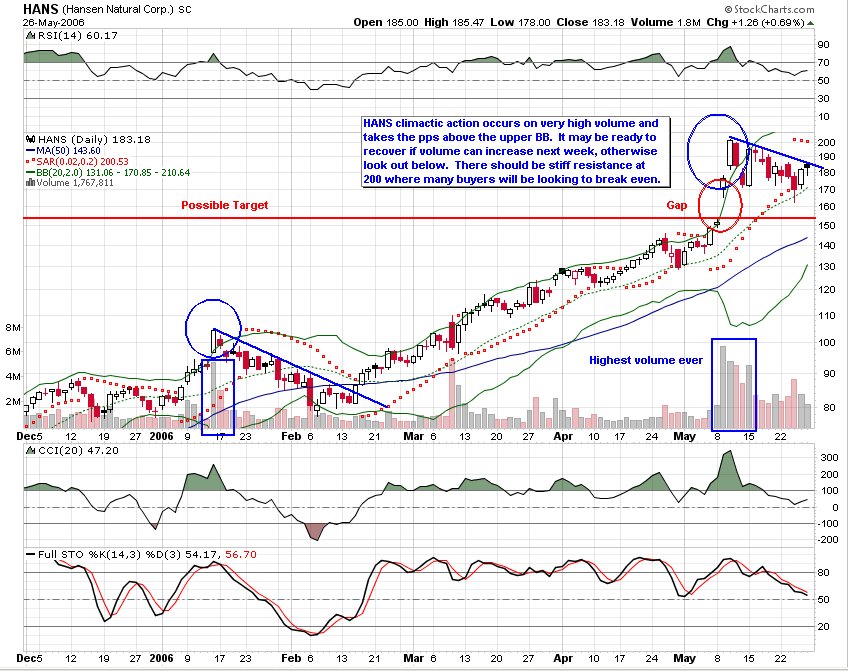
The high at 200 HANS put in a few weeks ago would have been a great place to go short. The high occured on the highest volume ever, a massive increase over the average. The move took it above it's upper BB before is topped out around the nice round 200$ level. There may be more downside, with possibly a gap fill if the volume doesn't pick up on the upside. The reward is limited here and was intended to me more of an example of a climactic action. From 200 to the upper end of the lower gap on the climax action there was over a 15% drop.
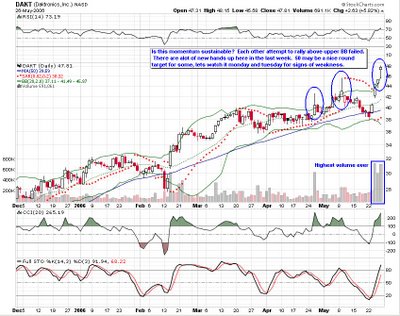
 There is a similar type of action in DAKT occuring now. The stock has vaulted above the upper BB on the highest volume days the stock has ever had. The last two times it tried this recently the stock sold off hard intra-day leaving the long tails circled in the chart. The current move looks like it could take DAKT to around 50, a nice round number for a top. If DAKT moved to the upper end of the first gap in this move (around 41) it would be just over 15% gain. Worth note was that DAKT announced a 2:1 split last thursday and may have contributed to the buying frenzy at the end of the week. I read this in an Oneil's book over the weekend: "It is also helpful (to the shorts) if a stock has recently split... The second time a stock splits is usually at a much later stage in the stocks overall move. This is normally too obvious to the crowd to be a rewarding stituation... Like everything else in the stock market it is a simple issue of supply and demand with a large potential supplyof stock that could be offered for sale in the market place."
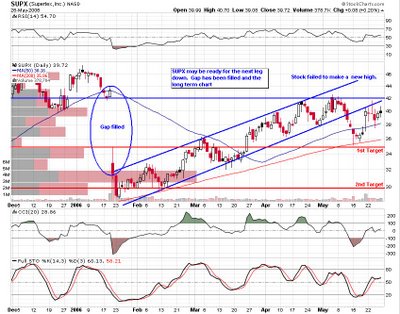
 SUPX jumped out at me in a scan of the IBD 100. It was 76 last week, is now 97 and apears to be comming off for good unless is can shake off some recent sellers. After filling a huge gap down on the biggest volume ever the stock failed to move higher and broke out of its channel up to that point. It now appears to be pausing before the next major leg down.
Also, I still think AAPL is set up to run up to the upper end of the triangle mentioned last week. I added calls on friday.
 There is a similar type of action in DAKT occuring now. The stock has vaulted above the upper BB on the highest volume days the stock has ever had. The last two times it tried this recently the stock sold off hard intra-day leaving the long tails circled in the chart. The current move looks like it could take DAKT to around 50, a nice round number for a top. If DAKT moved to the upper end of the first gap in this move (around 41) it would be just over 15% gain. Worth note was that DAKT announced a 2:1 split last thursday and may have contributed to the buying frenzy at the end of the week. I read this in an Oneil's book over the weekend: "It is also helpful (to the shorts) if a stock has recently split... The second time a stock splits is usually at a much later stage in the stocks overall move. This is normally too obvious to the crowd to be a rewarding stituation... Like everything else in the stock market it is a simple issue of supply and demand with a large potential supplyof stock that could be offered for sale in the market place."
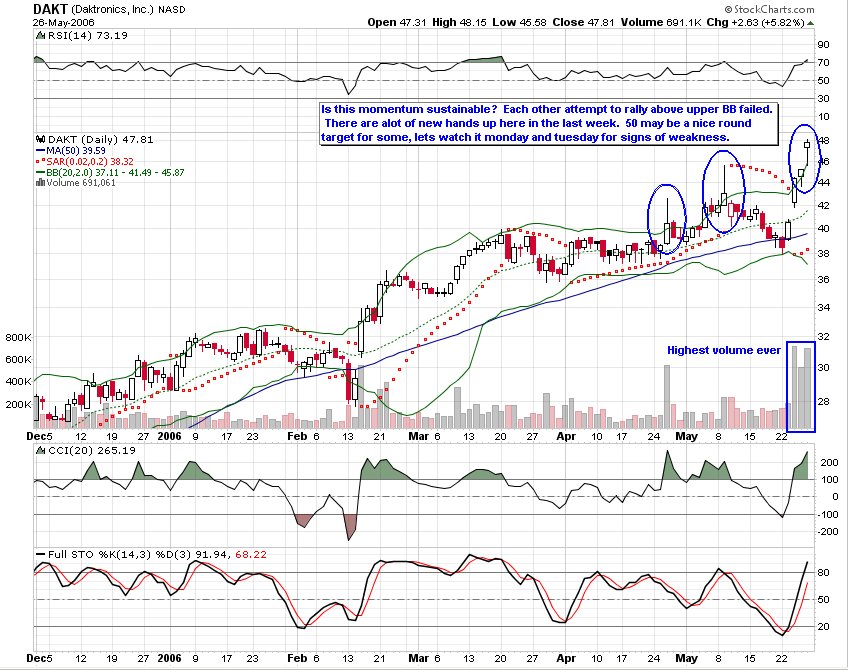 SUPX jumped out at me in a scan of the IBD 100. It was 76 last week, is now 97 and apears to be comming off for good unless is can shake off some recent sellers. After filling a huge gap down on the biggest volume ever the stock failed to move higher and broke out of its channel up to that point. It now appears to be pausing before the next major leg down.
Also, I still think AAPL is set up to run up to the upper end of the triangle mentioned last week. I added calls on friday.
Saturday, May 27, 2006
The S&P 500 SPDR is bouncing off it's 200 dma
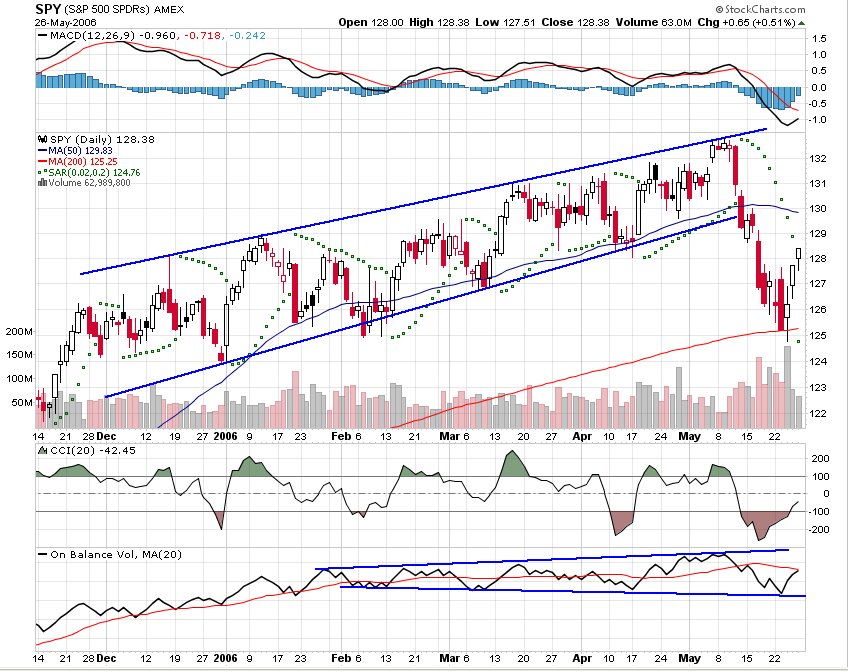
Kudos to Dan for nailing this bottom in the Spider ETF that tracks the S&P 500 last week. Clearly the bounce still has upside momentum and should continue for at least a few more points, notice it closed at the high friday. Since the breakdown out of the rising channel it had been in occured with significant volume it sould be taken as a serious break in the chart. This bounce would then constitute a throwback back up to the breakdown point and resistance around the 50 dma. However, it is possible for the throwback to go as high as the previous high made, forming a double top. But it would encouter significant reistance on the way, and I would not expect it to make it that far. Notice the broadening wedge forming in the on balance volume, things may really start to get ugly when the OBV fails to make a new high and begins to break down. I think the market is shaping up for a perfect shorting opportunity when this bounce runs out of steam in the next few weeks. Right now I am looking for solid compnaies bouncing off their 200 dma for longs (like AAPL) and not so solid companies about to reach their 50 dma, or worse, for shorts (like PLCE). Dan may provide us with futher insight into the SPY next week.

Friday, May 26, 2006
Symetric Triangle in AAPL
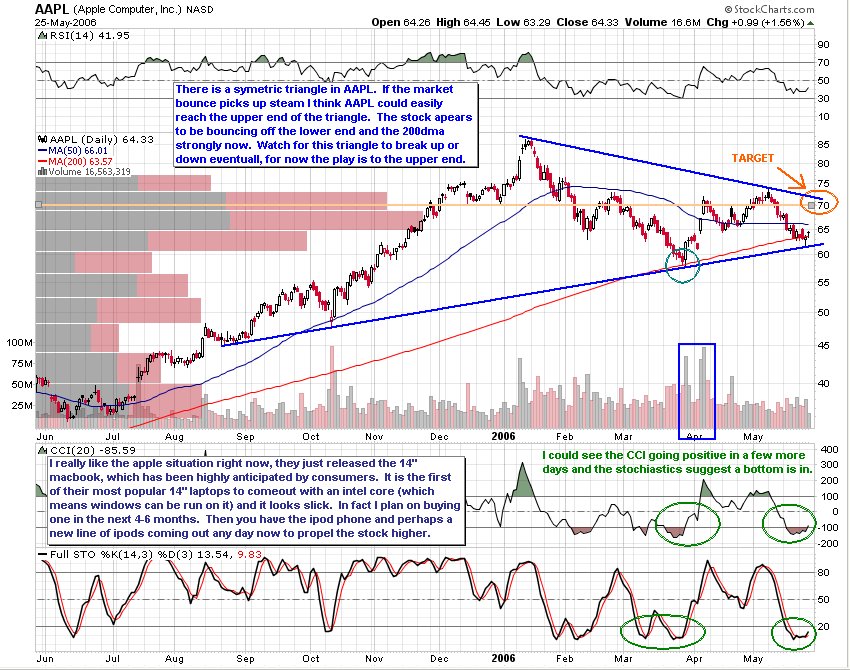
There is a long term symetric triangle in AAPL. The stock recently bounced off the lower end and the 200 dma, it is poised to reach the upper end around 70 soon. I got into this one today with some AAPL June 67.50 calls and will be looking at getting some June 65's tomorrow as well. There are more details about my reasoning in the chart below. Click on it and zoom in to read my comments.

Also, check out the link on the right hand side of the page to "Market Observations." I agree with the author about GOOG being good for a quick bounce trade. It seems to have found support at 360, the upper end of a gap zone, and is poised to head higher, perhaps the mid 400's is achievable. I like the 390 calls because the premium isn't that bad considering it's GOOG. The stock has been in a 10 day period of decreased volatility which may change very quickly if it breaks 385 and runs. In otherwords the implied volatilty may increase on those June calls and you can make money on that as well as the stock appreciation. A word of caution, there is some resistance at 390 and the 50 dma lies there. I would target 400-410 on this trade and don't expect 390 to present too much troublle if the market agrees.
Also, check out the link on the right hand side of the page to "Market Observations." I agree with the author about GOOG being good for a quick bounce trade. It seems to have found support at 360, the upper end of a gap zone, and is poised to head higher, perhaps the mid 400's is achievable. I like the 390 calls because the premium isn't that bad considering it's GOOG. The stock has been in a 10 day period of decreased volatility which may change very quickly if it breaks 385 and runs. In otherwords the implied volatilty may increase on those June calls and you can make money on that as well as the stock appreciation. A word of caution, there is some resistance at 390 and the 50 dma lies there. I would target 400-410 on this trade and don't expect 390 to present too much troublle if the market agrees.
Wednesday, May 24, 2006
Welcome to Stock Geometry!
I've created this blog mostly as a venue for me to store charts. I find myself emailing charts all the time and figured I might as well just upload them to one place and just give out a web address. Initially this will be a weekly updated site, with my picks for the week being posted on Sundays. Please let me know what you think, input is always welcome.
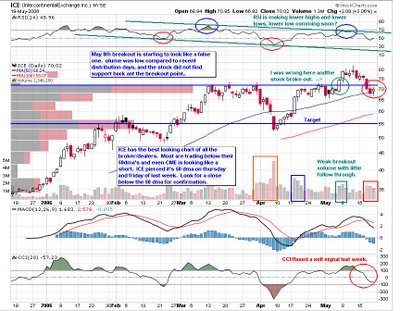
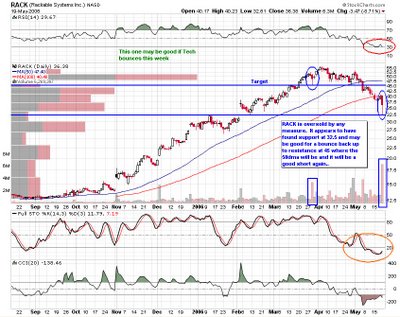
This week's picks were ICE short, and RACK long. Please note that I picked these last Sunday, so the charts are no longer current. But I think they are useful nontheless.
ICE has already collapsed down to my target around 55, unfortunately I missed the ride. SIlly me. I am now long at 54.30 looking for the right shoulder of a head and shoulders top. Notice how it closed today(not on this chart) right at support, I think it is a good short term long. My target on the long is the 50 dma.
I bought RACK calls at the open monday and sold them yesterday for a quick 40% profit. It's direction from here is unclear to me.
This CME chart may be of interest, it apears to have the most room to fall of all the broker/dealers. If ICE is any indicator of CME's future this may be a great short. I see a long term top, maybe a slanted head and shoulders on this one. Note, it is halfway to my 400$ target.

This week's picks were ICE short, and RACK long. Please note that I picked these last Sunday, so the charts are no longer current. But I think they are useful nontheless.
ICE has already collapsed down to my target around 55, unfortunately I missed the ride. SIlly me. I am now long at 54.30 looking for the right shoulder of a head and shoulders top. Notice how it closed today(not on this chart) right at support, I think it is a good short term long. My target on the long is the 50 dma.

I bought RACK calls at the open monday and sold them yesterday for a quick 40% profit. It's direction from here is unclear to me.

This CME chart may be of interest, it apears to have the most room to fall of all the broker/dealers. If ICE is any indicator of CME's future this may be a great short. I see a long term top, maybe a slanted head and shoulders on this one. Note, it is halfway to my 400$ target.

Subscribe to:
Posts (Atom)
