Saturday, February 24, 2007

Bottoms in IMCL and TMY

Towards the close on Friday IMCL pushed through some major resistance of a declining trend line that began last May. With a very large short interest in this stock and the impression that a bottom is in place, IMCL could make a big move up to at least test it's 200 dma currently around $32.50. The stock does not want to trade below very strong support just under $28 which places a nice safety net below. Also, with the stock just over $30, the March and April 30 calls are interesting.

Another nice looking bottom play is in the oil exploration company TMY. Energy is a very hot sector right now with oil having put in a bottom and this volatile stock has formed what looks to me like an adam and eve double bottom. Confirmation of the pattern will not come until the stock moves above 3.86 so I would wait for a break of that level to get real excited. The stock popped Friday on good volume after they announced completion of a new well.

Monday, February 19, 2007

Beautiful DTC Chart

This 6 month DTC chart is a perfect example of the natural beauty that you often see in a stock chart. This is a stock that showed up on my scan for new fifty two week highs on stocks with heavy option volume, in fact it was number one in this scan as of the close last Friday. What I see in this chart is a self similar pattern (not unlike a fractal) with the most recent breakout looking almost identical to a previous 13% move. This places the near term target at $11.09 which is quite a premium from the $9.19 close Friday. Other aspects of the chart look nice that can be seen highlighted in the chart below (click on it).
In particular, check out that volume. Over the last few weeks the volume expansion in DTC is staggering. This is a undeniable confirmation of the move's validity. While we are talking about volumes check out these unbelievable March option volumes on Friday. The open interest and volume in the $12.50 strikes definitely suggests it will head for that price. Wow, up.
This was the 50th post here at StockGeometry, thanks to the contributors (indigo, btb and namec) and the readers for your insight and support. So far I'm very happy with the way the blog has developed, cheers! -pythagoruz

Sunday, February 11, 2007

DDS / RTH & NDAQ for Options Expiry

To follow up on between the bar's well thought out and approriately timed comments about Dillards (DDS) last week I wanted to talk about the DDS chart and its relation to the Retail Holders ETF (Exchange Traded Fund) with ticker symbol RTH. The RTH is just an equity that represents a mix of retail stocks plus a small fee to Merril Lynch. It basically represents the combination of all the big department-type stores including stocks like Wallmart, Home Depot and Federated (Macy's) among others (but not DDS as far as I can tell). In any event read the previous post if you want to hear more about retail's fundamentals. I have above the DDS stock price divided by the RTH which is guaging DDS's performance relative to the RTH (the sector). Areas where this fraction rises is when DDS outperformed the retail sector and areas where is fell are when it underperformed the sector. What you see is similar but slightly different from the actual DDS chart, which in this case turns out to make a large difference in the message. Essentially, on this ratio DDS appears to be at very fierce resistance here with the 50 day moving average above along with the upper BB's which are flat. This compares with something of a cunfusing breakout on the real DDS chart. And from a longer term perspective the 50 and 200 dma's in this ratio chart have been important technically as seen above. Long story short, when we remove the recent boost in the entire sector from the DDS chart it looks more like DDS is rolling over than breaking out like the real chart might suggest. This of course lines up with the fundamentals which have been drastically under performing the sector.
Just to keep us focused on the real equities here, I have the 10 day hourly DDS and RTH charts side by side above. In the DDS chart I have drawn in approximately to the best I can the real 50 day moving average and the DDS/RTH ration 50 day moving average. You can see that now really would be a great time to get short and if you want to be more conservative expect and wait for DDS to break it's actual 50 dma at 34.60, but by then it should be moving fast and the 35 puts (March or Even Feb) will be significantly more expensive. On a side note the RTH looks ready for some downside anyways, look at that huge volume sell off a few hours before the close last Friday...


Now I know there are some readers who are here looking for an options play. Trading options just before expiration is a good way to lose alot of money real fast, but every trade has a winner and a loser so that means someone else is making a bunch of money real fast. Anyways, NDAQ jumps out as kind of a no brainer. Its all over the news this weekend that their bid for the London Stock Exchange failed. And NYSE (NYX) has been seeing downgrades lately over volume concerns weighing on the sector. Furthermore, NDAQ is the dog in the sector and the fact that it is trying to breakout now so late in the rally is suspect. But why this week? Well options expire Friday and max pain on NDAQ is 32.50... uhh yeah that is about 5 points lower. This is a no brainer short/put play up here above it's upper bollinger band in my humble opinion. At least to$ 35 by Friday. By the way, make sure you click on the images above to zoom in for a better look. And don't forget to sell those February options this week!! Questions and comments are most welcome!

Sunday, February 04, 2007

Trading MSFT Options

When I looked at the MSFT daily (above) this weekend I thought that it looked like it might be a good short if I was inclined. But I wouldn't be inclined to short MSFT for no other reason than it moves too slow. Of course you could trade it on the margin but I don't think you would be able to justify the interest. So, naturally I took a look at the options as they provide the most possible trading leverage.

It turned out that MSFT options looked like they might be great to trade with very low implied volatility and super small spreads. Almost every Feb and March option has a spread of .02 or less which means you don't have to take a big loss on the initial purchase and makes exiting comfortable and easy. I particularly like the March 30 puts and calls because MSFT has a major pivot price there from previous resistance and now its 50 dma at 35.03. I would expect MSFT to bounce off 30 before eventually breaking it but you just have to wait and see. On any break below 30 you can expect the premiums to rise with volatility (also thought of as "fear") As news becomes available on the success or failure of Vista the implied volatility can be expected to rise from historically lower levels especially if MSFT closes below major support at 30$. I definitely have a bearish feeling about Vista and MSFT in general near these highs, but I won't get all that excited until it breaks 30$. Even after it does, both the puts and calls should be great for intraday moves. Here's a look at the implied volatility on MSFT over the last year:
A brief word of caution, options are the easiest way to lose money in the market as the large majority of them expire worthless. Furthermore, I would expect the MSFT Feb 30 Puts and Calls to expire worthless as there is so much interest in them and maxpain currently lies at 30$. So trade them, but DO NOT HOLD THEM TILL EXPIRATION. I may try again later after the superbowl to complete this post, until then enjoy the game!

Update: Tues Feb 6th: Well MSFT didn't waste anytime breaking 30, in fact it opened below 30 on monday and was unable to retrive the 50 day moving average. While this is definately very bearish the stock has been falling much faster than it typically moves and so i would try playing bounces back towards 30 more so than further downside. I definately wouldn't expect it to close below its lower BB, currently at 29.52 but falling fast. As far as the options, they have been great. I was able to get +.07 on .54 with the March 30 calls yest and +.20 on .68 with the Feb 30 puts today. If your broker enables you to place option orders in .01 increments you need to check these things out, i haven't seen any other options like these. And the bid/offer sizes are huge, as high as 3k.

Thursday, February 01, 2007

Cup and Handle in IOTN


Update: Well that nice formation quickly took damage Friday with a bearish engulfing stick on massive volume. It was encouraging to see some capitulation near the end of day as the price dropped below 5$ and the volume surged. While it closed at 4.99 I would still consider IOTN in ok shape so long as it doesn't close any lower Monday. IOTN is a very tough and often disappointing stock to trade, you really have to have nerves of steal to make money on it. I added more calls on the dip below 5.

Wednesday, January 31, 2007

PW Eagle Inc. Three possible outcomes.

PW Eagle Inc (Nasdaq: PWEI) is a publicly traded company that makes pvc piping in various grades and dimension. They won't be for much longer. Publicly traded that is. I'm sure they'll still be making pipes because apparently they are pretty good at it.

On January 15 PWEI announced that they had agreed to be taken over by J-M Manufacturing, for $33.50 per share, and the way things have proceeded since then I am convinced that there is little to stop this takeover from happening. There have been no lawsuits from minority shareholders. There have been no objections from any regulatory agency. And just as importantly, there have been no wild swings in the price of PWEI shares that might indicate the presence of, or even the rumor of, a second interested bidder. I'll talk more about that last point in a moment.

In this Reuters report, it states, "PW Eagle makes pipes and fittings and operates 12 manufacturing facilities across the United States. J-M operates 14 manufacturing plants in the U.S., producing pipes for water, sewer, electrical conduits and other uses." It seems like a good fit for both companies and I'm sure there will be substantial cost savings in the combined company.

In the normal course of events J-M Manufacturing would bring in a market specialist to slowly acquire the outstanding shares of PWEI, pending a shareholder vote on the matter. Given that just five or six institutional holders own a majority of PWEI the results of the vote are pretty much a given. If the institutional holders wanted to fight this deal, we would have heard about it before now. In fact, the specialists are already hard at work picking up the outstanding shares at a slight discount to the agreed price of $33.50. The company will be delisted shortly after the closing of the deal. That would be the normal, and first possible outcome, and the most likely in my opinion.

The second possible outcome is that this agreement fails for whatever reason. J-M can't arrange financing (seriously unlikely, imo), PWEI shareholders turn down the agreement (again, seriously unlikely), or fraudulent circumstances come to light (again...).

The third possible outcome is that a second interested bidder could make an offer. If there were a hint of that in the markets we would see chart action similar to Harrah's Entertainment (NYSE: HET), this week. The specialist here has been doing a yeoman's job of accumulating the stock at a slight discount. Until that is, this week. Nothing more than a rumor hit the market and it's a long time frame on the HET takeover. This sort of action could occur repeatedly while time drags by. Any party interested in PWEI is going to have to move quickly and I just don't see it happening. The one major shareholder has agreed to vote for the proposal and that is tough to fight.

I mentioned Harrah's about a week ago as a "comparable situation" just on the basis of the chart action. Someone pointed out that the situation among the PWEI short sellers is not comparable at all to the short selling in HET, which is minimal. I would contend that now, two weeks after the PWEI takeover announcement, the two situations are now comparable. Any short seller with half a brain has closed his position and moved on because they can also see that the second possible outcome is just not likely, and that would be the only way to profit from an on-going short position.

And while I'm talking about short sellers, let me just add a bit that I think far too many people forget, certainly among the posters on the yahoo boards. Short sellers, whether selling naked or not, do not operate in a vacuum. Even a major hedge fund will clear their trades through a larger tier-1 firm such as Goldman Sachs, or Bear Stearns, etc. You need to put up a significant amount of capital to get the attention of such an organization, particularly if you intend to trade a high-risk trading strategy. These traders are responsible for their position because their broker will not take a loss for them.

On the other side of a short selling transaction is a buyer, and those tier-1 firms and below are also responsible to their buy-side clientele. Even if my account has not actually been credited with the shares of a company that I purchase, my account will be credited with an entitlement that my broker creates. And that's important. My broker is responsible for having created that entitlement. My broker will automatically issue a "Forced Buy In Notice" to the seller in order to offset risk.

In a situation such as we are in with PWEI today, I, as a buy-side client will want my $33.50 for my shares. I can sell the shares that I think exist in my account, but if in fact I only have an entitlement and no shares are available to my broker to effect the trade on a cost-free, risk-free basis, my broker will use that "Forced Buy In Notice" and the short seller will ultimately lose. In todays situation, the former short sellers are clearing out just as fast as they can given the limitations of volume of trading in PWEI shares. Why should they face a forced buy in for $33.50 (or higher) in a few months when they can get out now at $33 or so?

Ok. Enough from me. I hope that was informative and helped somebody.

Sunday, January 28, 2007

IOTN wakes

I normally don't follow stocks that are as cheap and have disappointed so much as IOTN, but it is like an old friend that I grew apart from and like to check up on from time to time. This company seemed to be a home run a year ago as it reached almost $15 on major short-squeeze/technology-of-the-future mojo. Then slowly the truth about a "momentary" $100M+ production contract for its anti-IED system became known. Mainly that the system wasn't unacceptable to the military for various reasons and a contract was no where near. But tonight I don't want to get into the story or the fundamentals behind this once popular stock other than to say that "before the end of the month" (this week) government tests are scheduled for its new/upgraded anti-IED system. I used to follow it closely and now I just check the chart every week to make sure it still looks like crap, well when I looked this week I saw something I hadn't seen in a long time (it didn't look like crap).
IOTN broke out of a 9 month long downtrend that began with a 50% haircut over two weeks last May. Volume has been strong along with price gains and other positive technical indications. The rounded base IOTN formed on it's weekly below should provide a solid launch pad to it's 200 dma currently at $6.33 (50 dma) and $6.00 (200 dma). Support in the 5$ area looks like a great place to jump in for a quick ride and from way back the $6.5-8 area has been support and should now serve as resistance on this move. So I would target 7$ then wait and watch for news before re-entering. Generally speaking I like defense right now with all the talk of additional troops going to Iraq and a global arms race as the Mideast heats up.
Disclosure: I have March IOTN Calls but I wouldn't like to hold them that long if I don't have to.

Wednesday, January 24, 2007

The power of candle charting....

I've been studying Japanese Candlestick Charts for a while now and to be honest I hate the use of the Japanese names and/or their short form English names like "doji", or "evening star", or "hanging man", and the list of those names goes on, and on. They don't have any intuitive meaning to me.

For me, it's easier to actually look at an image and describe it, and here is where I'm going to give a huge plug to my favourite charting site StockCharts.com.

That is, without a doubt the best free charting site that I have ever found. I'm told that if you pay for membership you can get real-time charting. But that would not be the point of this post. I want to highlight a "japanese candle" that I don't see very often, but I recognize it as a "low reversal candle" because of its distinctive "unfilled red border color".


This candle shows that the stock opened below the previous close. That is why it is red in color. Because the stock closed above the open the candle remained "open, or unfilled". It is a rare candle and it is a sign of support in the market. It is a reversal signal, but like all candlesticks it requires a supporting candlestick.

Today, one day later we can see a "bullish rebound" candle in the NYSE Group stock. There will be no silly japanese names here. I call them as I see them!

Monday, January 22, 2007

Failed Breakouts in AAPL, DLB & NTGR

These three stocks all had decent breakouts over the last few weeks before selling off back below their breakout point. Now they each precariously lie just above their 50 day moving averages. They may prove to be decent shorts (or put plays) on a break of the 50 day. NTGR actually pierced it's 50 dma last Friday which can be a kiss of death even if the stock recovers it by days end. I would place my stop at the breakout price in each case.


Tuesday, January 16, 2007

Fuwei Films (FFHL) looks ready to resume

There weren't too many charts that jumped out at me over this long holiday weekend. Many stocks look like they are in the middle of moves which isn't really the best place to enter a position. ICE for example is certainly looking for a top now that it moved up out of the channel it had been in and looks parabolic (typical of climactic moves). However one decent looking company that just did an ipo about a month ago has a solid chart. There are no options traded on FFHL, but this fast moving Chinese film (materials) technology company looks ready to resume it's uptrend. Of course there is little history to make technical trade decisions based on, however the strength in volume and price following the ipo and the well formed flag consolidation are enough to bring FFHL to new highs in my humble opinion.

As far as their fundamentals, I couldn't find much. From yahoo:
"Fuwei Films (Holdings) Co., Ltd. and its subsidiaries principally engage in the development, production, and distribution of biaxially oriented polyethylene terephthalate (BOPET) films. Its BOPET films are high quality plastic films used in consumer based packaging, such as food, pharmaceutical, cosmetics, tobacco, and alcohol industries; imaging, such as masking films, printing plates, and microfilms; electronics and electrical industries, such as wire and cable wraps, capacitors, and motor insulations; and in magnetic products, such as audio and video tapes. The company’s principal products include printing base films; stamping foil base films; metallization or aluminum plating base films; laser holographic base films; matte films; and high-gloss films. It sells BOPET film products to customers and distributors in the flexible packaging industry. The company markets and sells its products in the People’s Republic of China, the United States, Japan, and southeast Asia. Fuwei Films (Holdings) Co. was founded in 2003 and is headquartered in Weifang City, the People’s Republic of China."

Ps. I have been working on software to interact with the Interactive Brokers API (program interface). If any readers use the IB TWS API or write code to assist in trading on other platforms, I would love to exchange ideas with you about your software.

Sunday, January 07, 2007

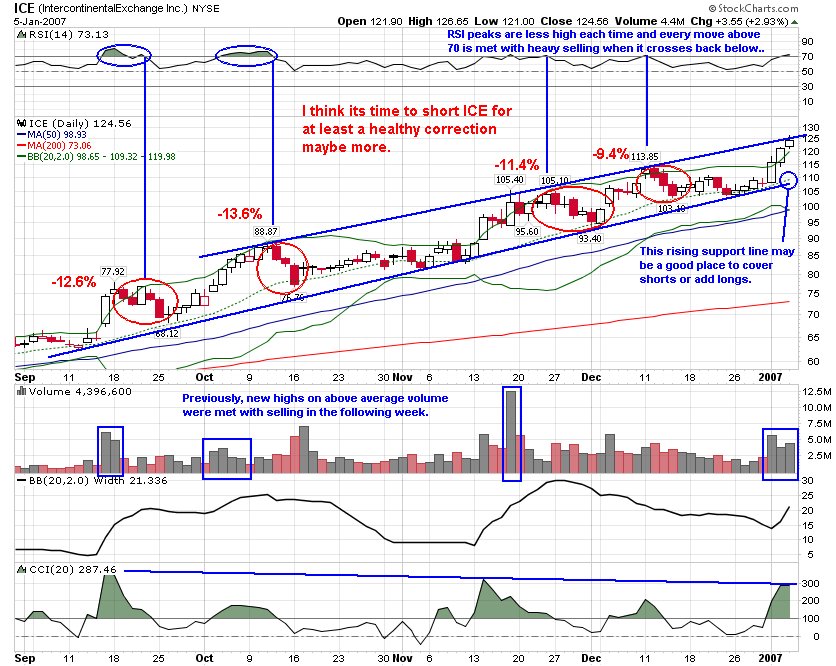
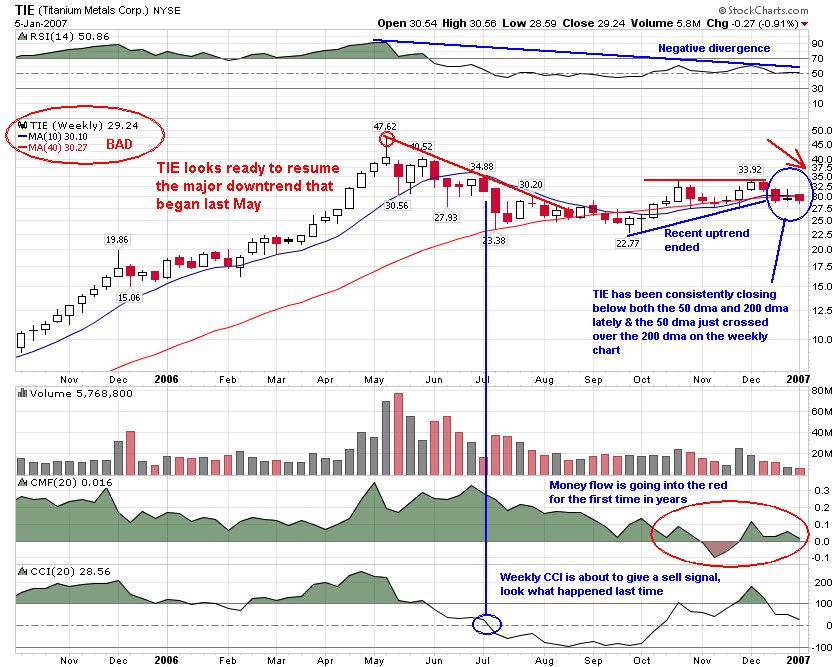
Short-term (ICE), long-term (TIE) and naked shorts (CREE)

I'm gonna let the charts do the talking this week, first a short-term (daily chart) short: ICEA long-term (weekly chart) short: TIE
A naked short (short em even if you can't borrow them): CREE
And a new years bonus short!!: MOS
Happy New Years from Stock Geometry!!!

Saturday, December 23, 2006

Hythiam (HYTM) The stock to own in 2007?

A look at HYTM by StockGeometry contributer Namec:

"Overview from HYTM 10k

We research, develop, license and commercialize innovative physiological treatment protocols designed for use by healthcare providers to treat individuals diagnosed with dependencies to alcohol, cocaine and methamphetamine, as well as combinations of these drugs. Unlike traditional treatment methodologies, our proprietary PROMETA treatment protocols include medically supervised treatments designed to address both the neurochemical imbalances in the brain and some of the nutritional deficits caused or worsened by substance dependence. Changes in brain chemistry and function play an important role in the physical and behavioral symptoms of substance dependence, including tolerance, withdrawal symptoms, craving and relapse. PROMETA represents an innovative approach to managing substance dependence that is designed to address physiological, nutritional and psychosocial aspects of the disease, and is thereby intended to offer patients an opportunity to achieve sustained recovery.
Traditional treatment approaches for substance dependence focus mainly on group therapy, abstinence, and behavioral modification, while the disease’s underlying physiology and pathology is rarely addressed, resulting in fairly high relapse rates. Currently therapies are beginning to target brain receptors thought to play a central role in the disease process. We believe that our PROMETA protocols offer an improvement to traditional treatments because treatments with PROMETA are designed to directly target the pathophysiology induced by chronic use of alcohol or other drugs. Without specific treatment, the abnormalities in brain function induced by chronic drug dependence may take months to years of drug abstinence to return to normal function. We believe the PROMETA protocols offer an advantage to traditional alternatives because they provide a treatment methodology that is discreet, mildly sedating and that can be initiated in only two to three days, with a second two‑day treatment three weeks later for addictive stimulants. Our PROMETA protocols also provide for one‑month of prescription medication and nutritional supplements, combined with psychosocial or other recovery‑oriented therapy chosen by the patient in conjunction with their treatment provider. Initial clinical observations suggest that our protocols may improve cognitive function, reduce withdrawal symptoms, be associated with higher initial completion rates than conventional treatments, and reduce physical cravings which can be a major factor in relapse, thus allowing patients to more meaningfully engage in counseling or other forms of psychosocial therapy. These conclusions were reached during treatment of approximately 400 patients and may not be confirmed by clinical research studies, may not be statistically significant, have not been subjected to close scientific scrutiny, and may not be indicative of the long‑term future performance of our protocols.


We believe the short initial treatment period when using our PROMETA protocols is a major advantage over traditional inpatient treatments and residential treatment programs, which typically consist of approximately 21 days of combined inpatient detoxification and recovery in a rehabilitation or residential treatment center. Treatment with PROMETA does not require an extensive stay at an inpatient facility. Rather, the protocols offer the convenience of a two to three day treatment (addictive stimulants require a second two day treatment three weeks later) and can generally be administered on an outpatient basis. This is particularly relevant since approximately 77% of adults classified with dependence or abuse are employed, and loss of time from work can be a major deterrent for seeking treatment. Moreover, we believe PROMETA can be used at various stages of recovery, including initiation of abstinence and during early recovery, and can complement other forms of alcohol and drug abuse treatments. As such, our protocols offer a potentially valuable alternative or addition to traditional behavioral or pharmotherapy treatments that does not require chronic administration of a pharmacotherapy, thus minimizing compliance issues. Many medications marketed to treat alcohol or drug dependence are not administered until the patient is already abstinent, require long‑term chronic administration and must be taken several times a day to achieve the desired effect.

Substance dependence is a worldwide problem with prevalence rates continuing to rise despite the efforts by national and local health authorities to curtail its growth. Substance dependence disorders affect many people and have wide‑ranging social consequences. In 2004, an estimated 22.5 million Americans suffered from alcohol or other forms of drug abuse or dependence, according to the National Survey on Drug Use and Health published by the Substance Abuse and Mental Health Services Administration (SAMHSA), an agency of the U.S. Department of Health and Human Services. Furthermore, according to the survey, approximately 12 million Americans age 12 and older, or 5 percent of the population, are reported as having tried methamphetamine, and the percentage of methamphetamine use characterized as abuse or dependence doubled from 2002 to 2004. Findings from The Drug and Alcohol Services Information System (DASIS) Report published by SAMHSA’s Office of Applied Studies in September 2004 show that methamphetamine hospital admissions as a percent of substance abuse treatment admissions increased from 1% in 1992 to 7% in 2002.

It is commonly reported that addiction to methamphetamine is an epidemic rapidly spreading throughout the U.S. Methamphetamine addicts are highly resistant to treatment and, even after intervention, relapse at very high rates. Methamphetamine use is also spreading to the workplace. A study funded by the Wal‑Mart Foundation in 2004 determined that each methamphetamine‑using employee costs his or her employer $47,500 per year in terms of lost productivity, absenteeism, higher healthcare costs and higher workers’ compensation costs. For county governments and their taxpayers, methamphetamine abuse causes legal, medical, environmental and social problems. A study entitled “The Criminal Effect of Meth on Communities” conducted in 2005 by the National Association of Counties, which surveyed 500 counties in 45 states, reported that 58% of counties surveyed reported methamphetamine as their largest drug problem, with 87% reporting increases in arrests involving methamphetamine starting 3 years ago. Cocaine was reported as the number one drug problem in 19% of the counties. There are currently no generally accepted medical treatments for cocaine or methamphetamine dependence.


Summarizing data from the Office of National Drug Control Policy (ONDCP) and the National Institute on Alcohol Abuse and Alcoholism (NIAAA), the economic cost of alcohol and drug abuse exceeds $345 billion annually in the U.S., including $41 billion in healthcare costs and approximately $245 billion in productivity losses. Despite these staggering figures, it is a testament to the unmet need in the market that only 17% of those who need treatment actually receive help. Traditional treatment methods are often not particularly effective, especially when it comes to those who are dependent on stimulants. Often faith, willpower, and counseling are the only options available. Compounding the lack of efficacious treatment options is the enormous stigma of leaving one’s life, income, and loved ones for weeks at a time to seek inpatient treatment.

There are approximately 13,000 facilities reporting to SAMHSA that provide substance abuse treatment on an inpatient or outpatient basis. Historically, the disease of substance dependence has been treated primarily through behavioral intervention, with fairly high relapse rates. The DASIS report states that in 2000 only 54% of those treated for alcoholism and 51% of those treated for cocaine and other stimulants complete detoxification, and that combined alcohol and cocaine outpatient treatment completion rates were only 41%. For patients who do complete treatment, the NIAAA reports relapse rates three months following treatment for alcohol dependence to be 50%. Relapse rates are higher for those suffering from cocaine dependence as opposed to alcohol. For the behavioral treatment of cocaine dependence, the Drug Abuse Treatment Outcome Survey reports a relapse rate of 69% one year

Our Solution: PROMETAÔ

Those suffering from alcohol and/or drug dependence have often been characterized as having social disorders or a lack of self‑discipline and, as noted above, there are relatively high relapse rates utilizing conventional treatment methods. While we believe the psychological approach to substance dependence treatment is important, we recognize that physiological factors of substance dependence should be addressed first to provide patients with an improved chance for recovery. We believe our physiological approach, focused on addressing the neurochemical imbalances in the brain caused or worsened by substance dependence, provides a substantial commercial opportunity.

Current research indicates that substance dependence is associated with altered cortical activity and changes in neurotransmitter function, which are critical to brain function. Moreover, changes in the neurochemistry of the brain underlie the hallmarks of substance dependence, including tolerance, withdrawal symptoms, craving, decrease in cognitive function and relapse. Our PROMETA protocols include medically supervised treatments, prescription medications and nutritional supplements, combined with psychosocial or other recovery‑oriented therapy chosen by the patient in conjunction with their treatment provider.

The PROMETA treatment protocols provide for:

· A comprehensive physical exam, including specific laboratory tests, prior to initiation of treatment by the treating physician, to determine if the patient is appropriate for the PROMETA protocol

· Medically supervised administration of prescription medications and nutritional supplements

· One‑month of prescription medications and nutritional supplements following the initial treatment

· Individualized continuing care options


Treatment with PROMETA involves the oral and intravenous administration of pharmaceuticals in a medically supervised setting. The medications used in the PROMETA treatment protocols have been approved by the FDA for uses other than treatment of substance dependence. The PROMETA treatment is discreet and does not require long periods away from home or work. Treatment takes place at a hospital facility, clinic or properly equipped outpatient setting by healthcare providers who have licensed the rights to use our PROMETA protocols. The treatment begins with a two‑to‑three day course of prescription medications and nutritional supplements. The PROMETA protocol for stimulant dependence provides for a second, two‑day course of treatment at the facility, which takes place about three weeks after the initial treatment .Some patients may require an additional day of treatment, subject to the treating physician making this decision during the course of the treatment. In general, the intravenous treatment session typically lasts about an hour. Some patients may receive their treatment in a hospital, or “in‑patient” setting. For these patients, the balance of time spent at the treatment facility or hospital is intended to ensure that the patient is well‑rested and comfortable between the relatively short treatment periods. Most patients take meals and choose to sleep much of the time between treatments. For the patients receiving care in an “outpatient” facility, such as a physician’s office or treatment center, their doctor may monitor them for a few hours following the treatment session. Typically, the patient would then be released to an accompanying person and return the following day for completion of their treatment. Following the medically supervised treatments, our protocols provide that patients receive one month of prescription medication and nutritional supplements, and participation in psychosocial or other recovery‑oriented therapy they select with their physician.

Analysis

At first glance HYTM appears to be to good to be true. A simple 2-3 day treatment using off patent drugs eliminates the physical cravings of drug abusers. However, the inital studies have produced remarkable anecdotal evidence that PROMETA seems to really work. There are several double blind placebo controlled studies underway that should be completed in 2007. HYTM is charging a lot of money per treatment but the economic cost of drug abuse is staggering. HYTM needs to be on your radar screen because the upside potential plus media attention could be huge. The chart says the market is starting to believe.....

"
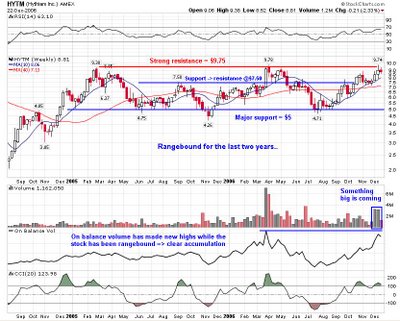
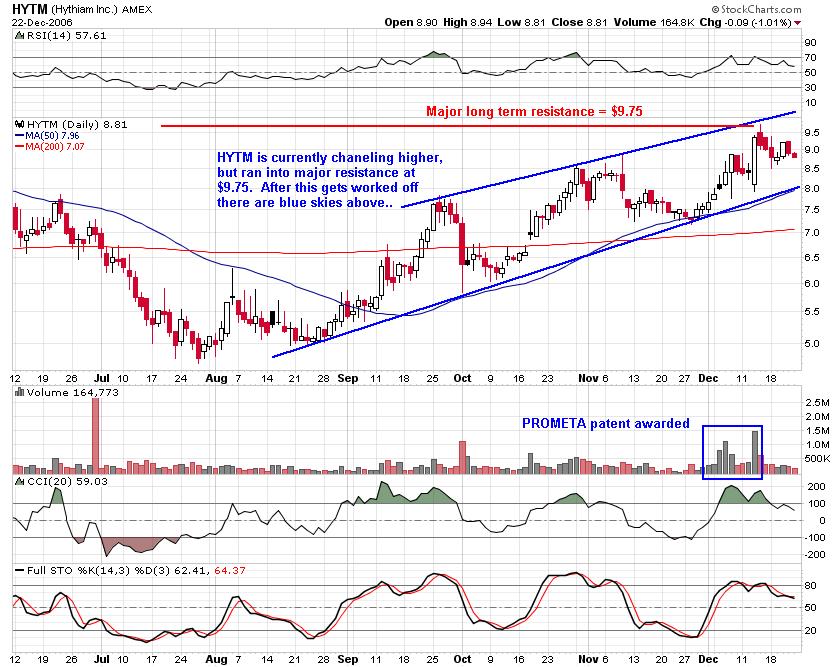
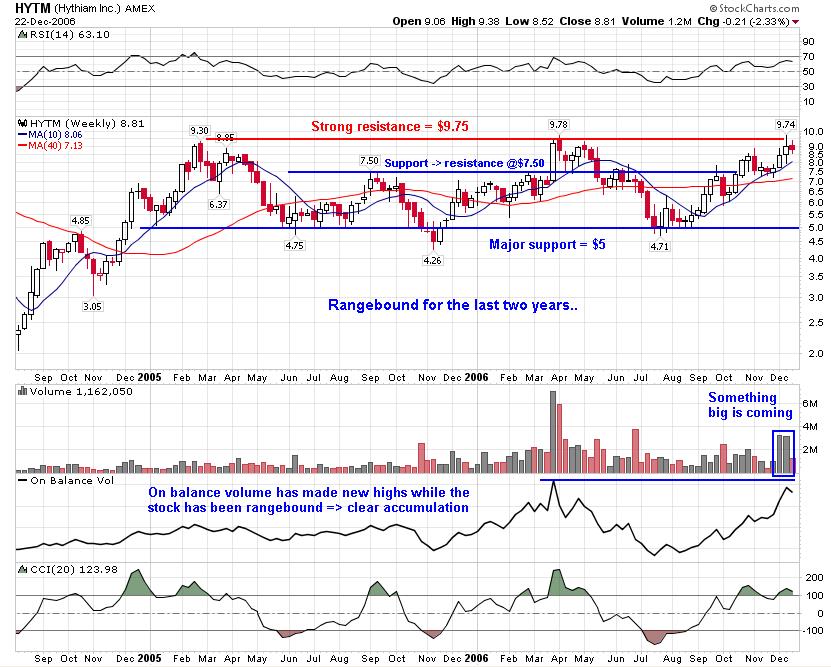
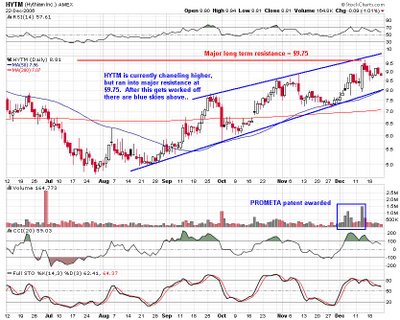
To follow up on Namec's comments, HYTM is in a space that has massive potential with few competitors. With a current market cap of only $350 Million next to a $40 Billion market the grow prospects are obvious. The two and a half year weekly chart above shows HYTM is about ready to breakout of a long period of consolidation. After moving up from the 2$ area HYTM has been rangebound for about two years between $5 and $9.75. On each push up towards resistance the volume has increased and the action has been more well behaved. What i mean by well behaved is how the stock reacts with respect to the moving averages. Specifically, on this last run HYTM held it's 50 dma more consistently than before. Also, the on balance volume has steadily been increasing while the stock has remained rangebound, that tells me the stock is being accumulated. I wouldn't jump into HYTM just yet, but as Namec said keep it on your watch list and watch for a move above key resistance at $9.75. If I see this thing trading at $10 or higher I will be all over a calendar spread on the $10 calls, and yes it trades options. However, if you really like the story you might try picking up shares at the 50 dma, or support at $7.50 if it pulls back that far. Happy holidays from us here at stock geometry!

Sunday, December 17, 2006

Are the CIEN & RBAK Bulls Back?

The networking stocks have been on fire lately, with many names staging breakouts like RBAK and CIEN while others continue to make new highs like CSCO. CIEN had a major correction from the high in May but looks ready to resume that uptrend. On a weekly basis (above) CIEN has cleared the moving averages and the only resistance ahead apears to be the previous peaks following the May high. These resistance levels at $30.87, $33.67 and $33.34 would provide short term targets for those who want to trade it aggresively. In the same sector RBAK has similarly been fantastic and looks destined to reach its previous high at $25. After these recent moves both CIEN and RBAK may need to rest, but this would provide a good entry opportunity. The ideal entry on both would be their 200 day moving average's (dma) but a close below these levels would be a strong sell signal.

The catylist for last weeks breakout was CIEN's 4Q earnings report in which they showed a profit for the first time in 5 yrs. RBAK's catylist was a contract from a Chinese telecom providor to provide broadband equipment for IPTV on top of the CIEN report, and CSCO buyout rumors. Both companies are benefiting from a worldwide boost to increase bandwidth which is a trend I wouldn't expect to dissapear anytime soon.

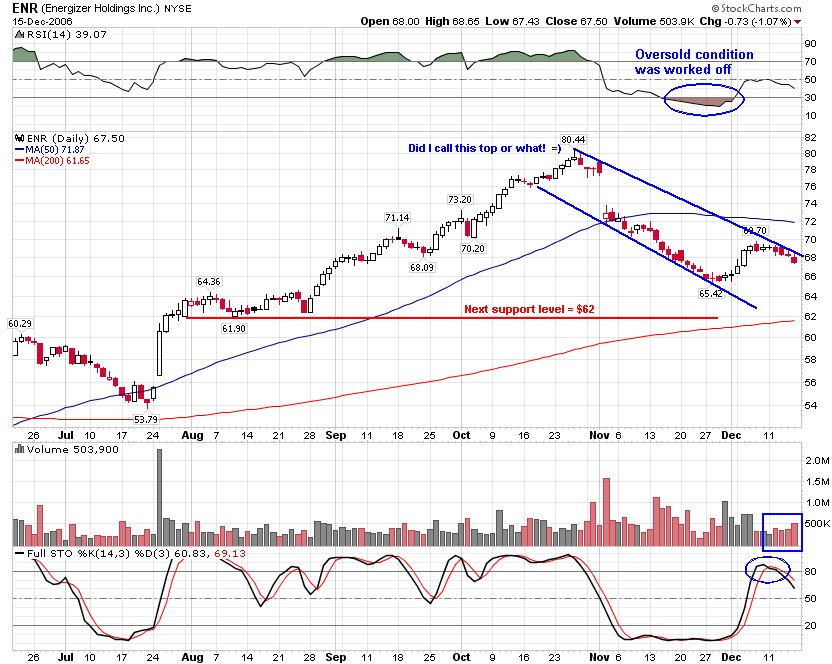
On a less bullish note, ENR looks ready to make the next leg lower. After a bounce from the $65 area ENR looks ready to test its 200 dma which I expect to be in the lower 62's when it gets there. There is also some chart support at $62 so this is where I would expect it to bounce next.
Happy holiday trading!

Sunday, December 10, 2006

Massey Energy (MEE) and Oil Priced in Gold

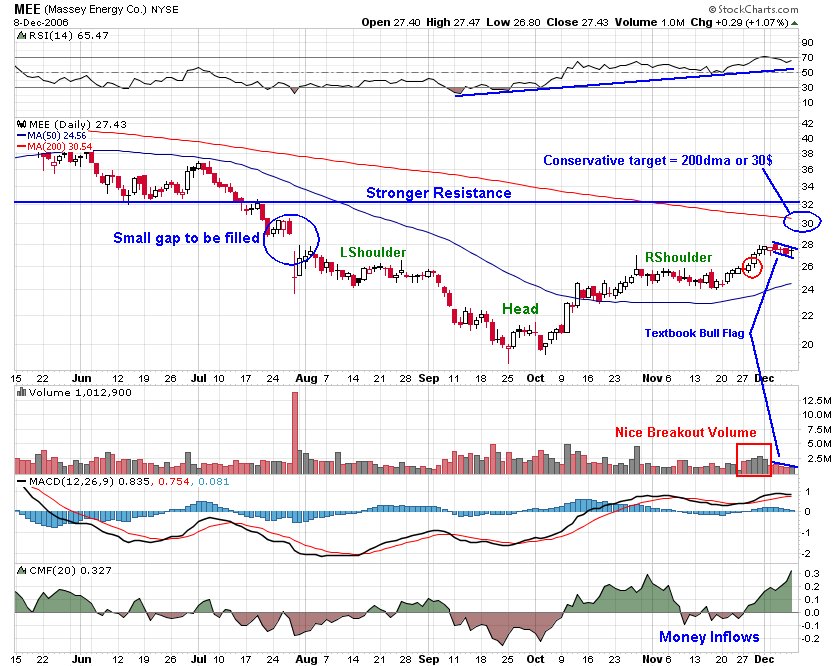
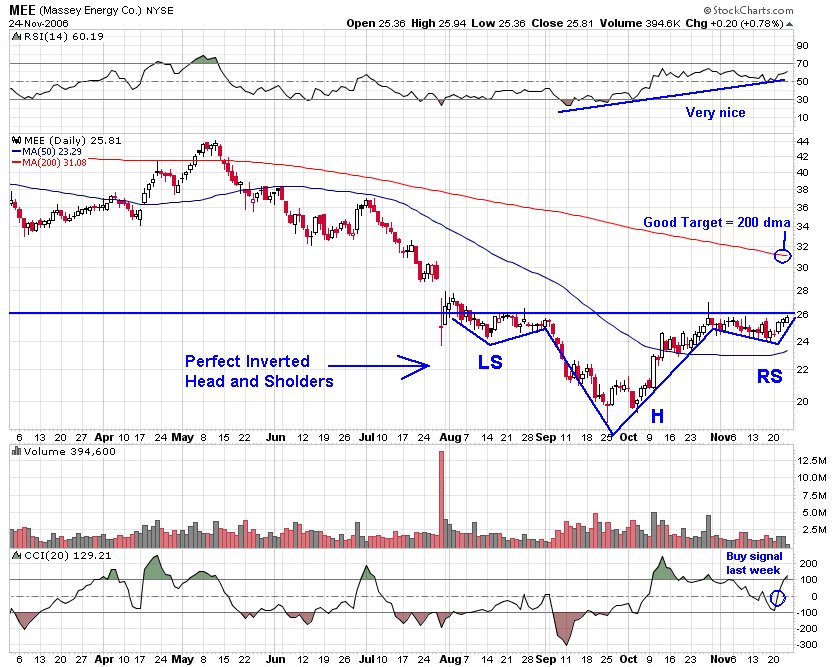
That inverted Head and Shoulders (H&S) I mentioned on coal company Massey Energy (MEE) completed a few weeks ago and the chart couldn't look better. Last week MEE formed a textbook bull flag and looks ready to resume the uptrend early this week. I like this well behaved stock and it has plenty of room to run to get back to the former highs. Next week it should pop as it fills a small gap made back in late July, see the chart for more color:
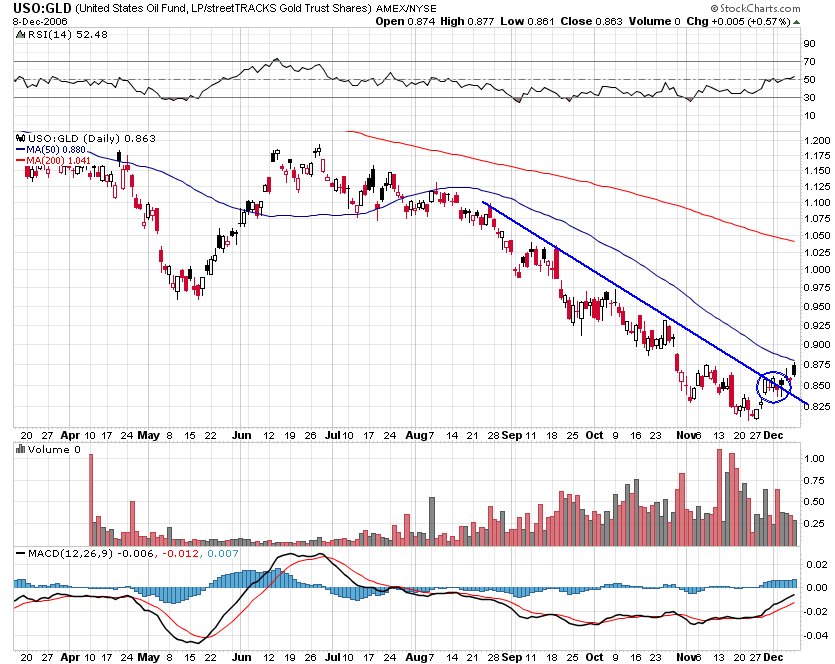
As you know I am quite bullish on energy after oil bottomed and in fact many oil stocks have been making new highs lately. For those who might argue that oil is only going up because it is priced in US dollars which have been very weak lately take a look at the chart below. I have USO (oil etf) divided by GLD (gold etf) which effectively gives you oil priced in gold. You will see a clear break of the downtrend there and what looks to me like much more upside ahead. Also, more on the decline in the US dollar later this week.
For those of you who are here looking for options expiration (friday) trades I suggest you focus very closely on the exchanges sector. I suspect ICE puts will be the trade of the week, but I have clearly been wrong on ICE lately. NYX has been closing at the lows almost everyday since it last made a new high and a top is blatantly obvious to me there. NDAQ has formed a small H&S on it's daily that will complete on a close below 36 (also the 50 dma). And ICE, well the chart looks pretty bullish, but I think the excitement over the vote after the close monday to merge with the NYBOT is way over done. In the least i would expect this to be a sell the news play and in the most it could start to drop fast monday morning and not look back all week. Thats just my gut feeling, you have too many people banging the table for $120 on expected news. Also, take a look at the open interest on the dec ICE options, there will be downward pressure from all those calls 95$ and up that recently went in the money. Im not a big believer in max pain theory, but max pain will certainly be lower than ICE currently trades.

disclosure:
I own ICE puts and MEE calls.

Sunday, December 03, 2006

Oil Breaks Out, Exchanges Top, Broad Distribution

So I think the charts pretty much speak for themselves but I have a few comments to add. Be sure to click on each chart for a better veiw of what is going on. I would now say that oil is definately in a confirmed uptrend until USO breaks below it's 50dma, this means buy energy stocks. My favorite charts in the sector are MEE, BTU, MRO, XTO, CVX and the etf's XLE and OIH. But to be honest every energy stock i look at has an awesome chart.

Last week the exchanges saw some major selling after a huge run-up of the entire sector. The worst hit were NDAQ, NYX, NMX and ICE. The New York Stock Exchange (NYX) for example, made a parabolic run through 100$ on speculation that the merger with european exchange Euronext would be approved. Par (100) had made a good target but it was met with major selling and now there are a ton of new NYX holders in the red. In the very least the stock needs to pullback to a support zone near it's 50dma around 85$. I don't expect the previous high just over 90 to hold, but it may provide an intermediate bounce.
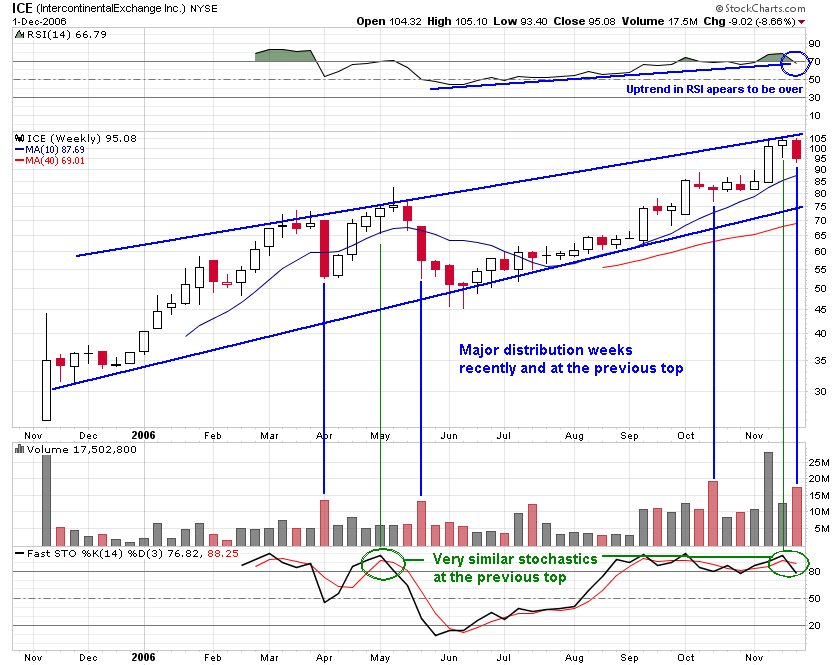
The weekly ICE chart below looks like it may have formed it's second major top since the IPO. Many aspects of the chart look similar to the last peak. I would target the 50 dma first then a rising trendline currently around $75.
With the exchanges leading this market higher for weeks as oil went lower the broad indicies had a major run higher. With the leadership being taken out and oil reversing the dow, s&p and nasdaq all saw a major week of distribution. I don't want to speculate too much here other than to say watch for more signs of weakness as this market may be forming a top or at least correcting.

Disclosure: I own NYX puts.

Sunday, November 26, 2006

Three Breakout Setups: BBY, CHS & MEE

Well it looks like we got the strongest black friday in years and retail should be strong next week, that includes EBAY btw. I think those dec RTH 100 calls are still a good play on that strength, or just buy Best Buy (BBY). BBY looks like it could easily complete a long term cup with handle soon, the trigger is a close above 58$. Check out this weekly chart, the cup n' handle breakout is one of the most profitable patterns out there:
Fundamentally, I think this will be a very good season for Best Buy for a few reasons. Obviously there is a big buzz around the game industry right now and they seem to have cornered the nintendo wii market. I tried to get a wii at my local best buy last week and today. They had 100 on the launch and 70 this morning on the second shipment. Since I didn't camp out I was not able to pick one up on either occasion like many many others even though i was there before the store opened. I did however end up buying a bunch of dvd's for x-mas presents... This compares with my local GME. They had twelve wii's on the launch day and one, yes one on the second shipment. Plus the whole issue surrounding used games that i keep talking about with GME doesn't exist with BBY. Another reason is this new best buy rewards program they have going this year. I am a memeber and without going into details let me just say that I think it will be very effective in gaining market share this year.
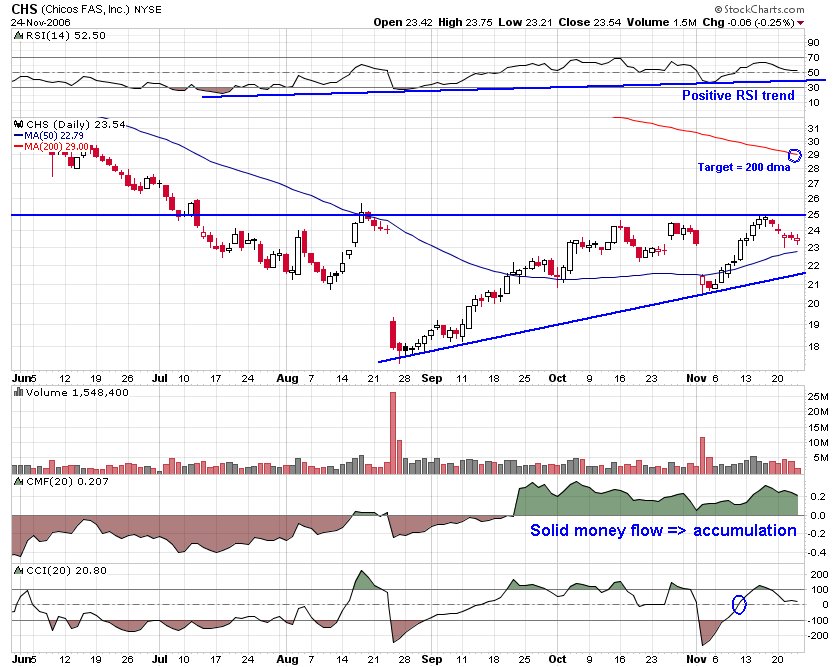
Another possible play this week on retail is Chicos, CHS. They report earnings after the close on tuesday, so like JWN wait until wednesday morning to jump in if they impress. The chart is set up for a nice breakout if it can move above 25$ on this report. So I would buy the 25$ dec or jan calls on wednesday morning about 15 min after the open if it gaps up and moves over 25. Oh and by the way, congrats to those who took my advice on JWN. That stock moved as expected and made new all time highs in the lower 50's last week after reporting. Here's a fun fact, Nordstroms's (JWN) only has two sales a year and neither occurs duing the holidays. They get the surge in shoppers on black friday like all the other retailers, but they don't have to pay for it with major discounts. That is one well run company, imo.

I also still like ADM long for a swing trade, it seems to have found support. That stock will move like Deere (DE) once people realize they are profiting off the corn spike as well (why DE has been so strong). Also, here is a random energy stock chart that I like alot, especially if we get a move in oil (which I have been expecting). The buy trigger on MEE is 26, as close above this price will complete a perfect inverted head and shoulders:
Remember, if you miss the breakout look for a throwback to the breakout price intraday or in the following weeks. The odds of getting a throwback depends on the pattern, statistics can be found in the links above. Don't chase a stock that you have clearly missed the boat on. Good luck, and congrats on those ENR profits! -pyth

Saturday, November 18, 2006

Ride the Retail Train

To follow-up on indigo's post last week I'd like to think about a few ideas for the holiday rally. First of all we are in a very strong market heading into the santa claus rally time frame. It is widely expceted that consumers will be eager to spend spend spend this christmas in celebration of lower gas prices (lower than 6 months ago) and higher wages (yoy). How will they spend their money?In the the retail apparel sector I like JWN and they post earnings monday after the close. They will undoubtably beat expectations and raise guidence as they always do. JWN is the best retailer and I speak from experience, if you have ever been in one you know what I'm talking about. That being said, the premium on the calls is too high to try and buy them ahead of earnings and why take the risk? I would recomend buying JWN (calls) at the open tuesday assuming the numbers are good enough to get JWN over $49 as a close above this price would make way for the next leg by completing the bull flag. The chart (above) couldn't be more bullish, pull up a weekly if you like the daily.
For a more conservative play on a booming season for retail buy dec or jan RTH 100 calls. RTH is the retail index etf that includes names like best buy (my fav), home depot and also clothing retailers. While the etf has not been able to hold above 100 on recent moves into this new territory, it looks poised to call par ($100) support soon.

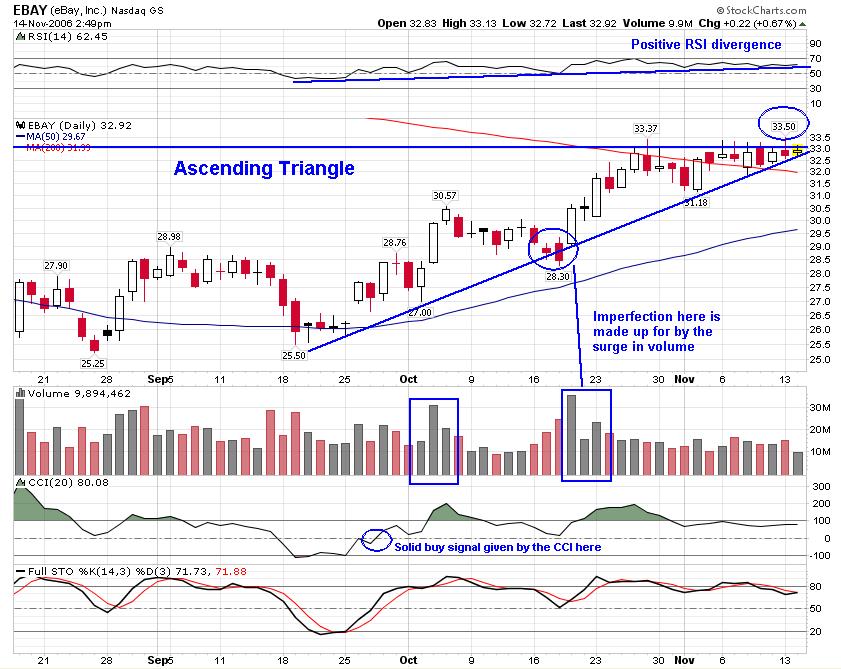
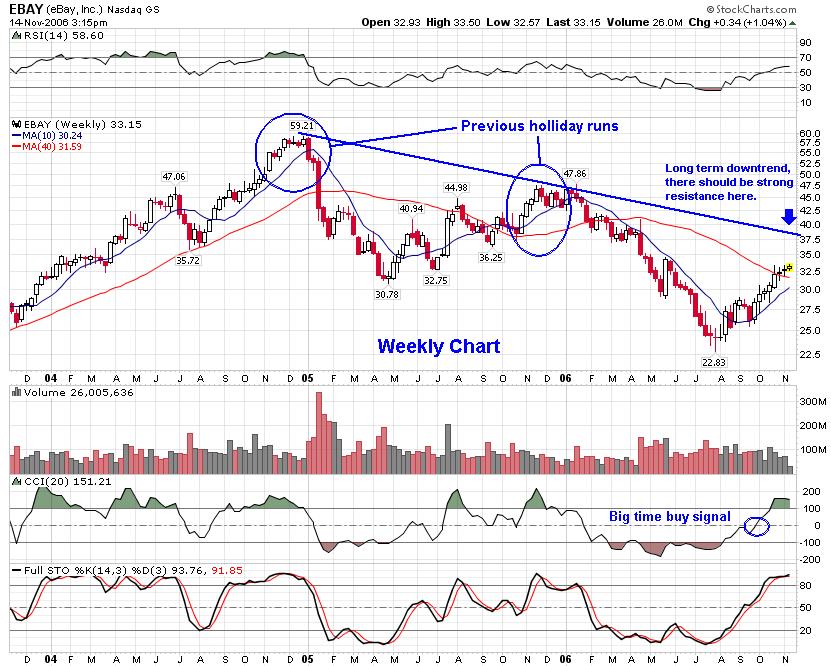
The video game industry is in the midst of a boom phase in that cylce with three new consoles on the market this christmas. Unfortunately, Sony (SNE) had manufacturing problems, Microsoft (MSFT) sucks and Nintendo is only traded on the japanese exchanges. As I mentioned a few months back I don't like the brick and morter game shops because the new consoles enable players to download old games online rather than buy the used ones stuck in GMR's inventory. But what about ebay? For one thing they will benefit from the fact that the new nintendo system and the playstation both play games from older systems (used games). Then theres the half of all those people waiting in lines to get the sold out consoles that put theirs up for sale online for double, triple or in some cases much more on their money. It might be interesting to find out what the turn over rate is on consoles as ebayers try to flip consoles online at the peak demand closer to christmas. This is just one reason I like ebay, indigo pointed out a few of the others last week so see his post. The stock broke out of that ascending triangle and has plenty of room to run. I will be taking at least some profits on my calls around 37.50, the declining trendline from previous highs.
I will try to update the post during the week with links. Happy trading! -pyth

Tuesday, November 14, 2006

EBAY, preparing for lift-off?

As we approach the Christmas shopping season I like to look over the specialties retail plays, internets in particular, for chart positions that I like. AMZN and EBAY are the two that always come to mind. AMZN had it's pop after earnings so I've turned my attention to EBAY.

The short term chart is an ascending triangle that is displaying some obvious intra-day buying. Those upper candle wicks are a sign of buyers that are being sold to, so I went looking for the sellers. I found some of them among the November calls that expire this Friday. This is the maxpain effect at work. As there is no corresponding open interest among the puts, the closing of these calls is acting as an anchor on the stock price.
In my opinion, this ascending triangle couldn't be better formed. It will be broken, and soon, one way or the other. If the call trading takes the stock to $30, the maxpain point for November, the triangle will be broken to the down side. If this solid buying continues, we'll break out to the upside as early as monday, after the options related trading subsides.

With Christmas shopping just around the corner I am sure that EBAY will be doing all they can to provide press releases on their listings and transaction numbers so I'm taking the slightly longer trade. I bought the December $35 calls today at 50 cents.

Update: As of Saturday, November 18 this stock has broken out to the upside of the ascending triangle and held above the previous resistance. Late Friday trading was generally positive and the stock touched $34 in after hours trading on reasonable after hours volume.

I'm excited about the prospects for the stock, come Monday.

Sunday, November 12, 2006

Alternative Energy, I like PBW and ADM

I have been bullish on oil since USO apeared to bottom a few weeks ago. That hasn't changed and in fact many oil stocks have clearly bottomed and are moving up quite well. As you would expect, alternative enrgy stocks have mirrored this move to some degree but most of those stocks corrected very harshly after huge gains early this year. There is so much technical damage that ethanol stocks, for example, still trade below their 200 dma and some like ADM even trade below their 50 dma's. I think that this underperformance has provided a great opportunity in that sector especially in light of the democrat's return to power in the house and senate. While we shouldn't necissarily expect legislation to change dramatically we can expect the buzz around alternative energy to grow as the lawmakers hold hearings and complain on tv. I thought these top ten predictions on the impact of the elections were intertesting and probably correct. The first being that energy will go back up. For a great screen of ethanol, solar and all other energy stocks look here.
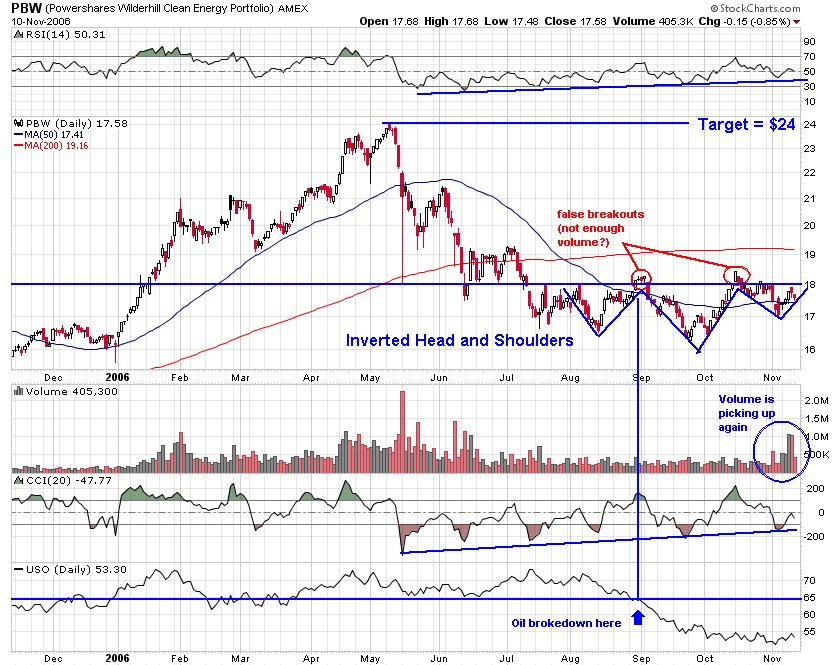
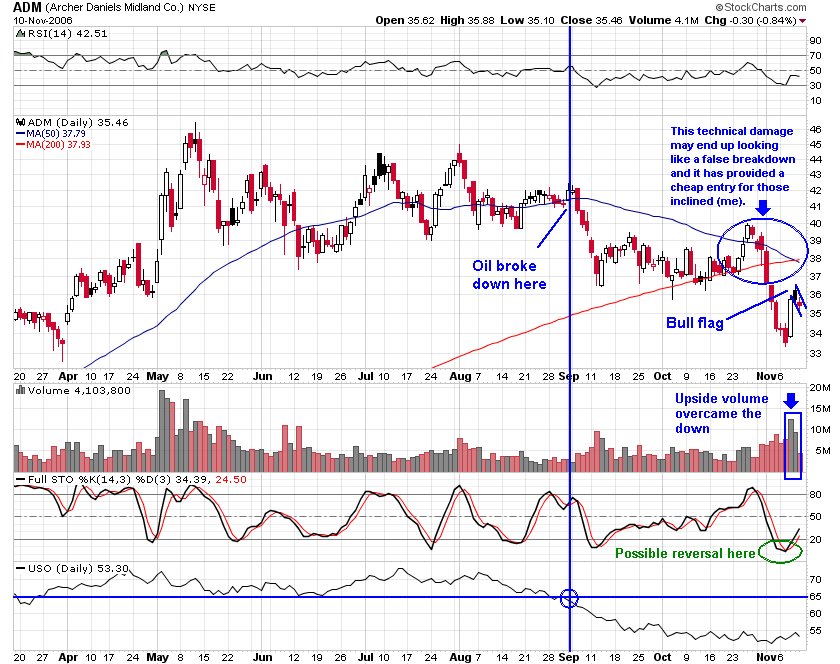
In the sector I like the alternative energy etf PBW, seen in the first chart above. Any move above 18 would complete the head and shoulders bottom and set up a run to the highs around 24. However, watch for false breakouts as this has happened twice recently. I wouldn't worry so much about this though because these breakouts occured while oil was in free fall, the USO plot is included for a comparison. PBW is nice because it is diversified among various alternative enrgy areas with an emphasis on solar which has been strong lately. I also like Archer Daniels Midland Co. (ADM) which has been getting reamed lately due to a spike in corn prices (which they actually are hedged against). ADM is making a killing off the ethanol boom as they are the leader in this sector. Higher corn prices are bad for their ethanol business but since they are also into corn processing and other agricultural services like storage and transportation they are well hedged and if fact should profit from an increase in corn prices. The chart (above) looks pretty bad, and if ADM was not such a solid company at a booming time for them I would have a hard time pulling the trigger. The ethanol sector is hot right now, and ADM is too cheap to not buy.

disclosure: I have ADM calls.

Sunday, November 05, 2006

ENR is Out of Juice (luckily its downhill from here)

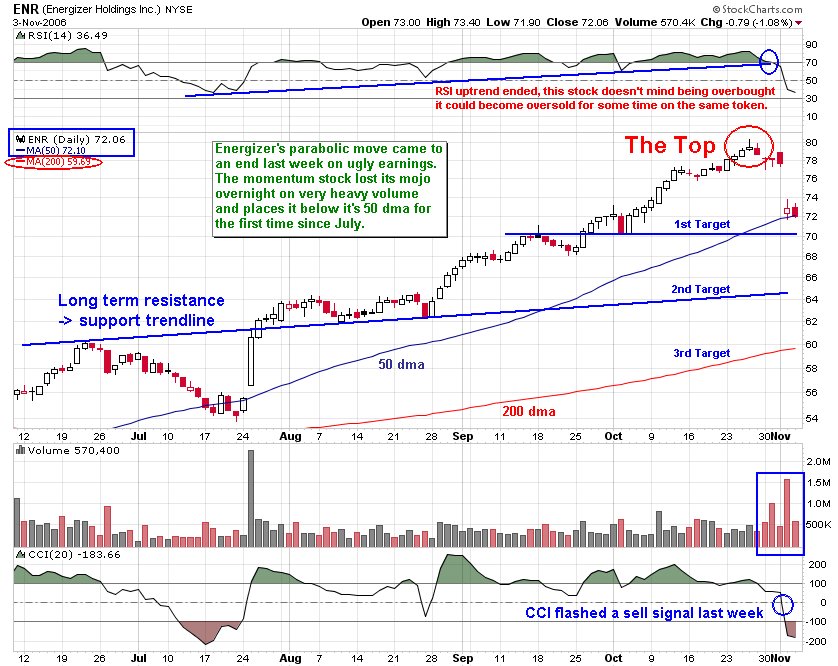
Energizer was a stock that kept on going and going... but no battery lasts for ever. ENR got into one of those grooves every long craves, a parabolic price increase. After moving out of a less steep uptrend at the end of July on yet another earnings beat ENR acclerated upwards. The stock attempted to top a few times but the dow's strength gave it's sails wind and ENR squeezed higher.
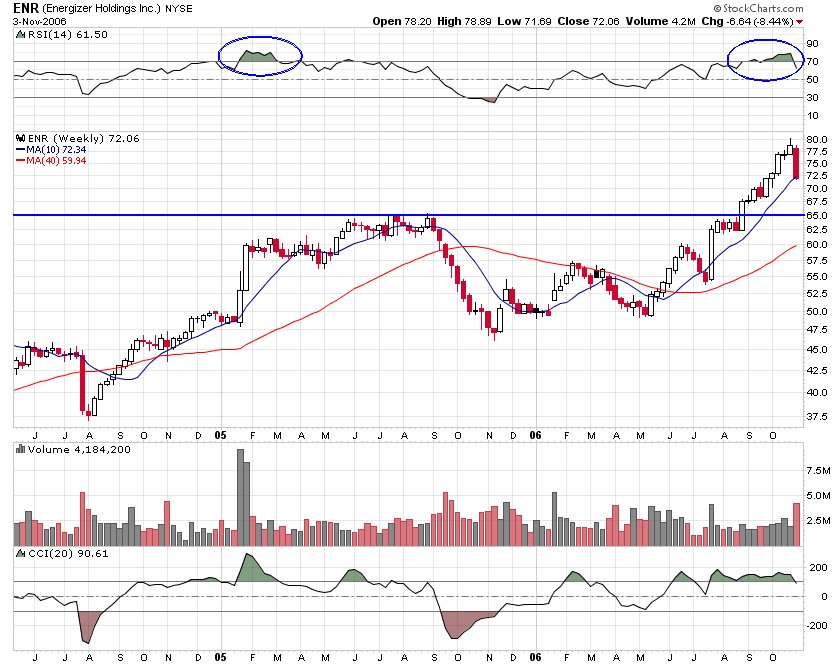
ENR remained overbought from the begining of September until last week when it topped just over $80 then reported a horrible quarter in which they saw profit fall 25% over last year, while revenue increased only 5%. For the year they showed a decline of 7% profit, in otherwords they are not exactly experiencing the robust growth (30% in the month up to earnings) that the stock price had been suggesting. Furthermore, ENR made an appearance in the upper IBD 100 for three weeks but came off this weekend and Morgan Stanley initiated with a sell rating last week before earnings. As mentioned a few weeks ago, I have been watching ENR and waiting for the trend to end before entering shorts (puts in my case). Well the time has come, my first target is weak support at $70 then there is some very strong suport on a rising trendline that had been resistance that currently lies around $65. Then beyond that the 200 dma should be very strong support currently at just under $60. This is one of the best looking shorts I have seen in a while with a close just below it's 50 dma on friday with heavy volume, ENR should be getting sold all week long. Here's a weekly 2.5 year chart to give you a feel for how ENR has behaved in the past, it also suggests $65 is a good target.
In addition I still like the energy sector and am holding some HAL calls. Many energy stocks have great charts and look ready to breakout like XTO or already have like CVX. However there are some quality names that have yet to recover that are looking very attractive like ADM and LNG. Also, keep an eye on the gold and mining stocks, they seem to have begun a new uptrend, I still like GG.

Disclosure: I have HAL calls and ENR puts. Email me if you want to know which contracts.