Sunday, May 20, 2007

Semi Shorts and a RIMM Breakout

I'm gonna try to make this week's post short and simple. All three of these stocks will trade with the nasdaq to a large extent. In the event of a strong QQQQ (nasdaq), RIMM just broke out of a long term consolidation. The weekly chart below suggests that RIMM is in the early stages of a big move upwards:
By the way, RIMM is 35 in the ibd 100 and investors business daily (ibd) just recommended RIMM as a buy.

The semiconductor stocks have been struggling for months but recently broke out. I think this breakout may fail as the sector has some real fundamental problems, mainly oversupply. VSEA is probably the strongest semiconductor stock right now and number 28 in the ibd 100. However, it recently rolled off a peak to below the midpoint of its bollinger bands (see below) which has spelled doom for the stock in the past (an many other stocks). I would keep a tight stop on the stock, but expect it to hit the first and possibly the second of the two targets seen in the chart below, especially in the case that the QQQQ sells off:

No matter what the nasdaq does WFR looks finished. I am going to try and stay away from the fundamentals as reasons to trade from now on, but lets just say that the polysilicon seller is running into a major oversupply of their product in 2008, not good. I already suggested WFR might be a short, but now that it is working I think it is a great example of what is going on in the the semiconductor sector. WFR appears to have just completed a long term reversal:
WFR is now 74 in the ibd 100, a dramatic fall from the top ten recently.

Disclosure: I own WFR June 55 puts.
Note: You are responsible for your own investment decisions, this is in no way intended to be a recommendation.

Sunday, May 13, 2007

A few nice charts and... IBKR

Looking over various stocks that I try to keep an eye on tonight, I've seen a couple really great looking charts. The commodity exchanges for example, look pretty solid, eg. ICE, BOT, CME.
Above I have what appears to be CME doing a reversal. It previously broke down out of a long term symetric triangle which led it into death spiral, the bull seemed dead. But after Friday's move CMEs chart looks fantastic, I like everything about the story the action and the options. ICE looks great too.

Another one I like it HYTM, which appears to be in the early stages of a ~36 week cycle. In the weekly chart below you can see a clear pattern in which HYTM makes a major low about every 36 weeks. In the past this low is followed by a powerful upside swing to the approximately the upper bollinger band which currently lies around $10. This is a long term move, but in the past the initial stage was the fastest. I will be prepared for some big swing or else set tight stops. They reported earnings last week.

My initial concerns about the IBKR ipo being over supplied and over priced turned out to be true. All of those that bought the ipo at 30 and those buyers since from 33 to 27.50 can't be happy. They doubled the size of the offering and the price went higher, it was pretty counter intuitive and now we see the consequences unfolding in the open market. Who knows how far IBKR will fall, but it has definitely picked up some downwards momentum:
My guess is that IBKR will at least test the middle of the initially suggested ipo price range. When I was informed by IB about the auction they said the expected range was $22.50-27.50 so I put in a bid at $25 which never got filled since it finalized at $30 and opened at $33 on the first day. There is very little to go on in expecting a support level, obviously there isn't much chart history, but I think we should be expecting it to bounce just was fast as it has dropped. One thing is for sure, IBKR is extremely over sold right now.

Disclosure: I own May HYTM 7.50 Calls

Sunday, May 06, 2007

IBKR is Born (Interactive Brokers IPO)

I normally like to annotate charts but this 10 month ICE daily above is a piece of art. After some consolidation and a healthy pullback this stock looks poised to blast higher. As the long time readers know I have a fascination with ICE and it has been interesting to watch it grow into being an extremely well behaved trading stock. But tonight I wanted to bring it up as an example of what a great IPO can do in the early years.

After a bullish yet erratic initial six months following the IPO (which happened to be on the day before my birthday, Nov 2005) the chart began to take shape. On the weekly below you can see how the stock has been able to develop a more clearly defined trend and pick up momentum. Also note how the volume has increased while the weekly candles have become smaller(less volatility). Just click on the chart below:

From a fundamental standpoint the Intercontinental Exchange and Interactive Brokers don't have all that much in common They are both in the business of options, a rapidly growing investment vehicle, however ICE is a commodity contract exchange while IBKR is an online equities broker. Their IPOs were somewhat different too, ICE offered up only 16 M shares and jumped substantially from the open on its first day of trading, although it closed far from the high of the day. IBKR on the other hand:

"The automated global options market maker and broker, rose 4% to 31.30 after hitting 34.25 intraday. Interactive Brokers raised $1.18 bil in its IPO, the biggest so far in '07. The offering was first planned for 20 mil shares at $23-$27 each. But Interactive Brokers (NasdaqGS:IBKR - News) ended up selling 40 mil shares at $30.01 each, at the high end of its revised range." -ibd

I use Interactive Brokers and aside from a few minor complaints I am pleased with them. They have a great trading interface which is software based and enables programmed trading without too much effort. As a broker they are great because they have very low commissions and I can chat with technical support with little delay about any sort of problem. What really makes me really bullish on the stock (after it finds support) is the fact that they only do 20% of the US options volume. With their platform so much more advanced for automated options trading I could see this market share increase dramatically and further the US options market is growing anyways. They have a great mission statement:

"Create technology to provide liquidity on better terms. Compete on price, speed, size, diversity of global products and advanced trading tools."
You can read more about Interactive Brokers here, its really a great story.

At any rate, they sold a ton of shares in a auction offering. So for now I would guess it needs to find some sort of equilibrium before beginning a good run, but you never know with IPOs. You can bet I will be watching this one, hoping to get some cheap shares soon and eagerly awaiting options on IBKR. The first day of a beautiful thing?:
By the way, all this new supply of online brokerage shares makes me want to short the other, lower quality brokers, ie. Ameritrade (AMTD). I guess that stock is trying to run on pin action or something, but I'm itching to buy some puts. I'll tell you about my experience with Ameritrade on another day, but most people know what I'm talking about.

Saturday, April 28, 2007

WFR is Getting Diced

Reasons to sell WFR:

  • broke it's 50 dma for the first time in 6 months on its highest volume ever
  • CCI gave a sell signal on this move (fell below 0)
  • stock has a huge following from momentum traders that may want to exit
  • sentiment has changed, WFR was downgraded Friday, earnings did not please
  • WFR is falling in the IBD 100, now 39 from 14 last week
Take a look at what happened last time WFR broke it's 50 dma after a long uptrend and the CCI crossed over, this occurred last year:

IOTN is in play again after Cramer pumped it 25% in the after hours by speculating that a big contract is on the horizon. Um yeah, like I haven't heard that a thousand times. Monday morning might be a great opportunity to get some 7.50 puts. Just a thought.

Also, CREE formed a perfect reversal candlestick Friday on no news, in fact it was quite bizarre. But it looks ready to resume it's trip to zero.

Disclosure: I own WFR June 55 puts and CREE May 20 puts

Sunday, April 15, 2007

No Post Tonight

I've been busy with taxes and a myriad of other things so I don't have a post lined up for tonight. I just want to remind everyone that it is options expiration this Friday, so keep that in mind. I will try and post a few plays for the expiration either Monday or Tuesday. You can also seek me out on the othernet during the day, my user name is pythagoruz. In the meantime, one of my new favorite bloggers Jim Kingsland had a great post on the broader market this weekend. You should check it out.

Update: The market is acting pretty irrational right now and the charts aren't giving me many nice setups. I just cant bring myself to participate in the market right now, in fact it sounds like many traders are getting chopped up. I'm hoping by the end of Wednesday things will clear up and I can find some good setups for Thursday, I will post if and when that happens. -py

Sunday, April 08, 2007

Nice Recovery, but Volume Please

On price action the broad market has staged a powerful rally from the March lows. Many market watchers are calling for a resumption of the uptrend and new highs, based on the swiftness of the recovery and the tendency of this market to "shrug off" (ignore) cracks forming in the US economy, a collapsing housing market and a "foreclosure tsunami" (sub-prime and more recently alt-A lending meltdown). It all smells like a roast, the amateur shorts are getting their clocks cleaned on this rally from the lows, the newbie funds are getting suckered into buying this rally and joe schmoe is being told that the glitch is now over, "time to buy again". Call me a conspiracy theorist if you want, but I don't buy this rally. The chartist in me says, ok well the chart is pretty bullish aside from the volume. On the DIA (dow jones) weekly chart this run looks like a text book bear flag on the linearly declining weekly volume, but one cannot deny the strongly upward price action:
On the other hand my gut continues to tell me this market is toasted and in for a long and potentially steep decline. I especially like shorts in the banking sector, companies like DSL, FED, CCRT, COF, BKUNA and even the higher tier firms like GS, MS and BSC. Also, retail is set to do a major face plant soon, I like GES, COH, CHS and NKE among other shorts. If you feel the itch to get long, betweenthebars found a great one in the silver miner SLW and I think he also recommends the health care company CELG. The biotechnology sector has been a strong performer lately and we may be in the midst of a baby boomer health care rally. IMCL, GILD and MRK have nice charts in that area. But I would be very defensive in nature on any long since in my view little stands in the way of another "glitch" day.

Wednesday, April 04, 2007

BOT Update

What looked too good to be true last weekend really was. BOT reversed out of gapfill mode around mid day on Monday and has driffed higher since. But $190 has proven to be resistance albeit weak, so I would exit any remaining short positions in BOT there. I should have been more clear about a stop last weekend, which should have been set at the top of the gap, $185. I made the mistake of not setting the stop myself and am still holding. I think there is still a decent chance of BOT heading back below $185 at which point I would want to be very short. Targets on short positions are circled in blue. Please click on the chart above.

Sunday, April 01, 2007

Beautiful BOT gapfill in progress

Fundamentals aside, this is a chart I would want to be heavily short right now. BOT closed Friday at is low of the day, which sets the upper end of a range of prices that BOT has never traded at before. The announcement by ICE a few weeks ago of their interest in merging with BOT sent the shares to new highs leaving behind a $20 gap from $165 to $185. Had this not occurred during a market meltdown and more importantly a CME and ICE meltdown the BOT gap may have held, but selling ensued and BOT has been filling the gap on high volume ever since $185 broke last Thursday. Kudos to ChicagoStock for bringing this trade to my attention and calling the $185 break early last week. I would expect BOT to reach the previous $176.89 high in no time, but maybe pause there as the range of never traded prices would be filled. The 50 dma should be at least tested (at $173.74 now) and eventually the compete gap filled (~$167). The only risk here is that a full scale bidding war ensues with ICE and CME raising their offers. I wouldn't expect this to happen but if it did you can bet both CME and ICE shares would sell off pretty hard and in both cases the offers are for almost all stock. In other words BOT should trade somewhat with ICE and CME. In fact, until recently BOT shares traded proportionally with CME as that merger was thought to be a done deal, although they have diverged as of late.

Disclosure: I own BOT puts.

Sunday, March 25, 2007

What Now? Short CCRT and Trade ICE

The market popped last week on the federal reserves shift to a neutral bias bringing the indices to the area where the big plunge a few weeks back began. I would say we are at a pivotal point in the market where we either move higher and continue the bull market to new highs and more new highs, or we bounce of resistance above and head lower. Economic issues are definitely suggesting a major sell off should be occurring right now, but the chart just doesn't agree. I have the DIA (Dow Jones ETF) 6 month chart above. You can see DIA is trying to move above its declining 50 dma but on lighter volume. Some of the indicators suggest lower prices while others suggest it will pop. My feeling here is that this is probably the best time to be shorting but we better not fight the tape, lets just look at a few charts that we can trade while we await some confirmation of a broad market trend.

Compucredit (CCRT) is one that I like fundamentally short and was given to me by contributor betweenthebars. They offer credit cards and other forms of lending to poor credit customers and have a business segment in sub-prime. I traded this one down on the last big sell off and now after a big bounce it looks like time to re-load puts:
A massive wall of resistance lies around $34 for CCRT including it's upper BB, 50 dma, 200 dma and a declining trend line. I'd recommend placing a stop at $34 and targeting $25.50 below.


As a follow up to the post last week about ICE. It broke $125 and sold off hard as predicted but I failed to notice another support level nearby in my previous post. There should be some support at a the low on the last substantial ICE pullback, $123.16. In fact this level held on Friday and the stock appeared to rally from this area into the close. I can see why the stock is selling off on the impression that ICE is about to get involved in a bidding war for BOT. I can also see why the stock should correct after running for so long to such expensive levels with no major correction. But this is turning out to be way too easy for the shorts. ICE needs a good explosive run to shake out shorts before the downtrend continues. I would buy the stock here hoping to sell it near its 50 dma at $140. Set a stop loss around $120 as the lower BB should keep ICE from falling too much in the short term.

Have a great week and as before I will post as soon as I fell like the market has decisively picked a direction. Disclosure: I own ICE calls and DIA puts.

Sunday, March 18, 2007

A Brief History of ICE

In November of 2005, the Intercontinental Stock Exchange went public in one of the hottest IPO's of the year and ICE was born. The initial offering price set by the lead underwriters Goldman Sachs and Morgan Stanley was $18-20. "By mid-morning, ICE shares had risen 63 per cent to Dollars 42.50." The ipo has found a steady stream of buyers since aside from a -45% correction (on mediocre volume) last Spring and the weekly money flow has stayed solidly positive until recently. ICE has had record volume in the last three weeks as it sold off through its 50 dma and previous upward channel. The weekly CCI is possibly about to give a major sell signal (by crossing zero), but the daily chart shows some divergence. If the correction last spring is any guide, expect the stock to get at least one wild swing in to the upside to shake out shorts and also expect the lower boulinger band to be the ultimate and final stop on the move down. My gut here is that ICE will hold support at $125 and bounce back up to its 50 dma or so before another big move lower. In the daily chart below you can see how any break of $125 will spell more doom and gloom for ICE. Long term support levels are only compiled from a year of data but they come in just over $100 and at $82.40 the previous high. Its a beautiful chart even though it looks like a train wreck.
In the end it really depends on the rest of the market which I think is too mixed up right now to forecast. The fed meets this week and we get housing numbers, furthermore, the charts have a look of indecision to them right now. Clearly there is a new downward trend solidly in place but the market may still want to swing around a bit as equities move into a state of equilibrium and continue moving in the path of least resistance. I will post a follow up later in the week, and/or the moment things start to become more clear to me about the near term direction of the market. In the meantime I recommend keeping a close eye on all investments. Be sure to set and honor your stops.

Sunday, March 11, 2007

One Hell of An Options Expiration

This may be one of the most volatile weeks the markets have seen in a long time. With all the crazy events of the past few weeks the VIX has skyrocketed. That goes hand in hand with alot of puts being bought, many more than usual. And stocks fell hard. On Friday all these March options will expire. Then you also have the sub prime insanity. Many many holders of puts in NFI, NEW, FMT, LEND and CCRT will have profits to take somehow. In addition the broader markets have been much more volatile lately. And now after an almost 50% retracement of the initial decline the markets could potentially fall very far just to retest the recent lows. If this drop did begin to happen then all the put sellers would have to cover themselves somehow. By shorting the stock or else preventing it from falling by buying tons... So it goes both ways, I would expect the sub-primers to pop huge next week because there are no shares available to short. As for the rest of the market, lets see the second wave down to complete a simple ABC correction. Click the CME chart above, I think it would move big this week.


Max pain for a few sub primes:

NEW: $12.50, currently $3.21
NFI: $20.00, currently $5.24

These are the most attractive.

Also, many of the big wall street firms post earnings this week and they will be big movers, for more on that situation check out my new favorite blog: The Kingsland Report.

Disclosure: I have CME and CCRT puts.

Wednesday, March 07, 2007

Nightmare on Wall Street

The horror, the horror.....

The ICE March 140 Puts, Two Day Chart:

Sunday, March 04, 2007

Off with their heads! GES to the Guillotine

What a difference a week makes. It looks like a combination of sub-prime implosion, rebounding energy, the end of the yen carry trade and a global market meltdown may have finally brought the end to this overextended and tired bull market. No single factor is to blame for the violent reversal but I think the spreading of sub-prime lending woes is the poster child of the end. What started off as the isolated problem of a few lenders going under has spread into a big sell off in all mortgage then banking and now all financial stocks. Of all the financial stocks you would expect the Wall Street giant Goldman Sachs (GS) to be the most immune. Well GS topped with a nasty high volume breakdown last week:

It is almost unbelievable that GS could drop from within a few percent of an all time high to 30$ lower in just a week. The scale of the technical meltdown in other leading stocks is staggering. You can see it clearly in CROX, NYX, ICE below, but open up a chart of just about any recently "great" stocks and it will be there. I want to be very clear about this action, this is no orderly pullback, no correction and no buying opportunity as the mass media portrays. In my humble opinion this is the end of the 4 year bull market and the beginning of a multi year bear phase. If you want more color on my broader view leave some comments or drop me an email.


In the past, when the market begins a large scale bear movement I have found the IBD top 100 often provides some of the best shorts. And it makes sense because these popular high growth stocks, and high priced stocks can't quickly turn sour as investors seek to lock in profits. One sector that you have heard me and betweenthebars (btb) be very bearish on is retail. Btb nailed the DDS call at 52 week highs as well as JWN. Both have subsequently fallen hard, but those as well as many other retail stocks have much further to fall. Take the IBD #2 stock for this week "Guess?" (GES).

With all the credit problems we are hearing about with the fall of the housing market you have to wonder why retail has been so strong. It would certainly appear as though it can only get worse from here especially if the US does follow through with an economic slowdown. Even if we don't go into a recession though, the psychology of a falling broad market will take retail stocks down hard. The best of them, JWN got it's head taken off on great earnings last week, the worst of them, DDS broke through major support. But GES is trying to hold out, as is common with the leaders (and it sure is a leader at #2 in the IBD 100). Furthermore, GES is expensive by any measure and currently sports the highest forward PE in the sector aside from COH. I think it goes to at least $60 before all is said and done but probably to $70 (-10) in the next few weeks. The 75$ March and April puts come to mind with the stock over $80. If you want conformation watch for 78.74 to be breached.

Here's a chart that looked similar to GES near the open on Friday. It also involves a top ranked IBD stock, in fact it is # 6 this week: ICE. It paid off huge for me and has much more expensive options (so its harder to profit from). I wouldn't chase ICE to the downside right away. It will undoubtedly test and hold its 50 dma, at least initially. But I would short the bounce. These following two charts also demonstrate what the indicators are telling you and how rapidly they can change over the course of a day.

Friday morning:


Friday after the close:


A common behavior to look for in the coming weeks is where a stock vascillates about it's 50 dma a few times. The 50 day moving average often provides very strong support as investors step in to buy the pullback. This leads to often multiple swings around the 50 dma level before the eventual plunge. The first big drop happens to start the move and the second big drop is usually this eventual giving up of the 50 dma. I will provide more examples of this behavior in the next few weeks, but keep in mind this oscillatory behavior when trading. Good luck out there. And stay short!

Ps. If you are wondering about all this sub-prime talk take a look at a few charts of these stocks: NFI, NEW, FMT, LEND, HBC and CFC. And there is going to be another big gap down in them all Monday as NEW basically said they are bankrupt last Friday.

Disclosure: I own CROX (June) and DDS (April) puts.

Saturday, February 24, 2007

Bottoms in IMCL and TMY

Towards the close on Friday IMCL pushed through some major resistance of a declining trend line that began last May. With a very large short interest in this stock and the impression that a bottom is in place, IMCL could make a big move up to at least test it's 200 dma currently around $32.50. The stock does not want to trade below very strong support just under $28 which places a nice safety net below. Also, with the stock just over $30, the March and April 30 calls are interesting.

Another nice looking bottom play is in the oil exploration company TMY. Energy is a very hot sector right now with oil having put in a bottom and this volatile stock has formed what looks to me like an adam and eve double bottom. Confirmation of the pattern will not come until the stock moves above 3.86 so I would wait for a break of that level to get real excited. The stock popped Friday on good volume after they announced completion of a new well.

Monday, February 19, 2007

Beautiful DTC Chart

This 6 month DTC chart is a perfect example of the natural beauty that you often see in a stock chart. This is a stock that showed up on my scan for new fifty two week highs on stocks with heavy option volume, in fact it was number one in this scan as of the close last Friday. What I see in this chart is a self similar pattern (not unlike a fractal) with the most recent breakout looking almost identical to a previous 13% move. This places the near term target at $11.09 which is quite a premium from the $9.19 close Friday. Other aspects of the chart look nice that can be seen highlighted in the chart below (click on it).
In particular, check out that volume. Over the last few weeks the volume expansion in DTC is staggering. This is a undeniable confirmation of the move's validity. While we are talking about volumes check out these unbelievable March option volumes on Friday. The open interest and volume in the $12.50 strikes definitely suggests it will head for that price. Wow, up.
This was the 50th post here at StockGeometry, thanks to the contributors (indigo, btb and namec) and the readers for your insight and support. So far I'm very happy with the way the blog has developed, cheers! -pythagoruz

Sunday, February 11, 2007

DDS / RTH & NDAQ for Options Expiry

To follow up on between the bar's well thought out and approriately timed comments about Dillards (DDS) last week I wanted to talk about the DDS chart and its relation to the Retail Holders ETF (Exchange Traded Fund) with ticker symbol RTH. The RTH is just an equity that represents a mix of retail stocks plus a small fee to Merril Lynch. It basically represents the combination of all the big department-type stores including stocks like Wallmart, Home Depot and Federated (Macy's) among others (but not DDS as far as I can tell). In any event read the previous post if you want to hear more about retail's fundamentals. I have above the DDS stock price divided by the RTH which is guaging DDS's performance relative to the RTH (the sector). Areas where this fraction rises is when DDS outperformed the retail sector and areas where is fell are when it underperformed the sector. What you see is similar but slightly different from the actual DDS chart, which in this case turns out to make a large difference in the message. Essentially, on this ratio DDS appears to be at very fierce resistance here with the 50 day moving average above along with the upper BB's which are flat. This compares with something of a cunfusing breakout on the real DDS chart. And from a longer term perspective the 50 and 200 dma's in this ratio chart have been important technically as seen above. Long story short, when we remove the recent boost in the entire sector from the DDS chart it looks more like DDS is rolling over than breaking out like the real chart might suggest. This of course lines up with the fundamentals which have been drastically under performing the sector.
Just to keep us focused on the real equities here, I have the 10 day hourly DDS and RTH charts side by side above. In the DDS chart I have drawn in approximately to the best I can the real 50 day moving average and the DDS/RTH ration 50 day moving average. You can see that now really would be a great time to get short and if you want to be more conservative expect and wait for DDS to break it's actual 50 dma at 34.60, but by then it should be moving fast and the 35 puts (March or Even Feb) will be significantly more expensive. On a side note the RTH looks ready for some downside anyways, look at that huge volume sell off a few hours before the close last Friday...


Now I know there are some readers who are here looking for an options play. Trading options just before expiration is a good way to lose alot of money real fast, but every trade has a winner and a loser so that means someone else is making a bunch of money real fast. Anyways, NDAQ jumps out as kind of a no brainer. Its all over the news this weekend that their bid for the London Stock Exchange failed. And NYSE (NYX) has been seeing downgrades lately over volume concerns weighing on the sector. Furthermore, NDAQ is the dog in the sector and the fact that it is trying to breakout now so late in the rally is suspect. But why this week? Well options expire Friday and max pain on NDAQ is 32.50... uhh yeah that is about 5 points lower. This is a no brainer short/put play up here above it's upper bollinger band in my humble opinion. At least to$ 35 by Friday. By the way, make sure you click on the images above to zoom in for a better look. And don't forget to sell those February options this week!! Questions and comments are most welcome!

Sunday, February 04, 2007

Trading MSFT Options

When I looked at the MSFT daily (above) this weekend I thought that it looked like it might be a good short if I was inclined. But I wouldn't be inclined to short MSFT for no other reason than it moves too slow. Of course you could trade it on the margin but I don't think you would be able to justify the interest. So, naturally I took a look at the options as they provide the most possible trading leverage.

It turned out that MSFT options looked like they might be great to trade with very low implied volatility and super small spreads. Almost every Feb and March option has a spread of .02 or less which means you don't have to take a big loss on the initial purchase and makes exiting comfortable and easy. I particularly like the March 30 puts and calls because MSFT has a major pivot price there from previous resistance and now its 50 dma at 35.03. I would expect MSFT to bounce off 30 before eventually breaking it but you just have to wait and see. On any break below 30 you can expect the premiums to rise with volatility (also thought of as "fear") As news becomes available on the success or failure of Vista the implied volatility can be expected to rise from historically lower levels especially if MSFT closes below major support at 30$. I definitely have a bearish feeling about Vista and MSFT in general near these highs, but I won't get all that excited until it breaks 30$. Even after it does, both the puts and calls should be great for intraday moves. Here's a look at the implied volatility on MSFT over the last year:
A brief word of caution, options are the easiest way to lose money in the market as the large majority of them expire worthless. Furthermore, I would expect the MSFT Feb 30 Puts and Calls to expire worthless as there is so much interest in them and maxpain currently lies at 30$. So trade them, but DO NOT HOLD THEM TILL EXPIRATION. I may try again later after the superbowl to complete this post, until then enjoy the game!

Update: Tues Feb 6th: Well MSFT didn't waste anytime breaking 30, in fact it opened below 30 on monday and was unable to retrive the 50 day moving average. While this is definately very bearish the stock has been falling much faster than it typically moves and so i would try playing bounces back towards 30 more so than further downside. I definately wouldn't expect it to close below its lower BB, currently at 29.52 but falling fast. As far as the options, they have been great. I was able to get +.07 on .54 with the March 30 calls yest and +.20 on .68 with the Feb 30 puts today. If your broker enables you to place option orders in .01 increments you need to check these things out, i haven't seen any other options like these. And the bid/offer sizes are huge, as high as 3k.

Thursday, February 01, 2007

Cup and Handle in IOTN


Update: Well that nice formation quickly took damage Friday with a bearish engulfing stick on massive volume. It was encouraging to see some capitulation near the end of day as the price dropped below 5$ and the volume surged. While it closed at 4.99 I would still consider IOTN in ok shape so long as it doesn't close any lower Monday. IOTN is a very tough and often disappointing stock to trade, you really have to have nerves of steal to make money on it. I added more calls on the dip below 5.

Wednesday, January 31, 2007

PW Eagle Inc. Three possible outcomes.

PW Eagle Inc (Nasdaq: PWEI) is a publicly traded company that makes pvc piping in various grades and dimension. They won't be for much longer. Publicly traded that is. I'm sure they'll still be making pipes because apparently they are pretty good at it.

On January 15 PWEI announced that they had agreed to be taken over by J-M Manufacturing, for $33.50 per share, and the way things have proceeded since then I am convinced that there is little to stop this takeover from happening. There have been no lawsuits from minority shareholders. There have been no objections from any regulatory agency. And just as importantly, there have been no wild swings in the price of PWEI shares that might indicate the presence of, or even the rumor of, a second interested bidder. I'll talk more about that last point in a moment.

In this Reuters report, it states, "PW Eagle makes pipes and fittings and operates 12 manufacturing facilities across the United States. J-M operates 14 manufacturing plants in the U.S., producing pipes for water, sewer, electrical conduits and other uses." It seems like a good fit for both companies and I'm sure there will be substantial cost savings in the combined company.

In the normal course of events J-M Manufacturing would bring in a market specialist to slowly acquire the outstanding shares of PWEI, pending a shareholder vote on the matter. Given that just five or six institutional holders own a majority of PWEI the results of the vote are pretty much a given. If the institutional holders wanted to fight this deal, we would have heard about it before now. In fact, the specialists are already hard at work picking up the outstanding shares at a slight discount to the agreed price of $33.50. The company will be delisted shortly after the closing of the deal. That would be the normal, and first possible outcome, and the most likely in my opinion.

The second possible outcome is that this agreement fails for whatever reason. J-M can't arrange financing (seriously unlikely, imo), PWEI shareholders turn down the agreement (again, seriously unlikely), or fraudulent circumstances come to light (again...).

The third possible outcome is that a second interested bidder could make an offer. If there were a hint of that in the markets we would see chart action similar to Harrah's Entertainment (NYSE: HET), this week. The specialist here has been doing a yeoman's job of accumulating the stock at a slight discount. Until that is, this week. Nothing more than a rumor hit the market and it's a long time frame on the HET takeover. This sort of action could occur repeatedly while time drags by. Any party interested in PWEI is going to have to move quickly and I just don't see it happening. The one major shareholder has agreed to vote for the proposal and that is tough to fight.

I mentioned Harrah's about a week ago as a "comparable situation" just on the basis of the chart action. Someone pointed out that the situation among the PWEI short sellers is not comparable at all to the short selling in HET, which is minimal. I would contend that now, two weeks after the PWEI takeover announcement, the two situations are now comparable. Any short seller with half a brain has closed his position and moved on because they can also see that the second possible outcome is just not likely, and that would be the only way to profit from an on-going short position.

And while I'm talking about short sellers, let me just add a bit that I think far too many people forget, certainly among the posters on the yahoo boards. Short sellers, whether selling naked or not, do not operate in a vacuum. Even a major hedge fund will clear their trades through a larger tier-1 firm such as Goldman Sachs, or Bear Stearns, etc. You need to put up a significant amount of capital to get the attention of such an organization, particularly if you intend to trade a high-risk trading strategy. These traders are responsible for their position because their broker will not take a loss for them.

On the other side of a short selling transaction is a buyer, and those tier-1 firms and below are also responsible to their buy-side clientele. Even if my account has not actually been credited with the shares of a company that I purchase, my account will be credited with an entitlement that my broker creates. And that's important. My broker is responsible for having created that entitlement. My broker will automatically issue a "Forced Buy In Notice" to the seller in order to offset risk.

In a situation such as we are in with PWEI today, I, as a buy-side client will want my $33.50 for my shares. I can sell the shares that I think exist in my account, but if in fact I only have an entitlement and no shares are available to my broker to effect the trade on a cost-free, risk-free basis, my broker will use that "Forced Buy In Notice" and the short seller will ultimately lose. In todays situation, the former short sellers are clearing out just as fast as they can given the limitations of volume of trading in PWEI shares. Why should they face a forced buy in for $33.50 (or higher) in a few months when they can get out now at $33 or so?

Ok. Enough from me. I hope that was informative and helped somebody.

Sunday, January 28, 2007

IOTN wakes

I normally don't follow stocks that are as cheap and have disappointed so much as IOTN, but it is like an old friend that I grew apart from and like to check up on from time to time. This company seemed to be a home run a year ago as it reached almost $15 on major short-squeeze/technology-of-the-future mojo. Then slowly the truth about a "momentary" $100M+ production contract for its anti-IED system became known. Mainly that the system wasn't unacceptable to the military for various reasons and a contract was no where near. But tonight I don't want to get into the story or the fundamentals behind this once popular stock other than to say that "before the end of the month" (this week) government tests are scheduled for its new/upgraded anti-IED system. I used to follow it closely and now I just check the chart every week to make sure it still looks like crap, well when I looked this week I saw something I hadn't seen in a long time (it didn't look like crap).
IOTN broke out of a 9 month long downtrend that began with a 50% haircut over two weeks last May. Volume has been strong along with price gains and other positive technical indications. The rounded base IOTN formed on it's weekly below should provide a solid launch pad to it's 200 dma currently at $6.33 (50 dma) and $6.00 (200 dma). Support in the 5$ area looks like a great place to jump in for a quick ride and from way back the $6.5-8 area has been support and should now serve as resistance on this move. So I would target 7$ then wait and watch for news before re-entering. Generally speaking I like defense right now with all the talk of additional troops going to Iraq and a global arms race as the Mideast heats up.
Disclosure: I have March IOTN Calls but I wouldn't like to hold them that long if I don't have to.

Wednesday, January 24, 2007

The power of candle charting....

I've been studying Japanese Candlestick Charts for a while now and to be honest I hate the use of the Japanese names and/or their short form English names like "doji", or "evening star", or "hanging man", and the list of those names goes on, and on. They don't have any intuitive meaning to me.

For me, it's easier to actually look at an image and describe it, and here is where I'm going to give a huge plug to my favourite charting site StockCharts.com.

That is, without a doubt the best free charting site that I have ever found. I'm told that if you pay for membership you can get real-time charting. But that would not be the point of this post. I want to highlight a "japanese candle" that I don't see very often, but I recognize it as a "low reversal candle" because of its distinctive "unfilled red border color".


This candle shows that the stock opened below the previous close. That is why it is red in color. Because the stock closed above the open the candle remained "open, or unfilled". It is a rare candle and it is a sign of support in the market. It is a reversal signal, but like all candlesticks it requires a supporting candlestick.

Today, one day later we can see a "bullish rebound" candle in the NYSE Group stock. There will be no silly japanese names here. I call them as I see them!

Monday, January 22, 2007

Failed Breakouts in AAPL, DLB & NTGR

These three stocks all had decent breakouts over the last few weeks before selling off back below their breakout point. Now they each precariously lie just above their 50 day moving averages. They may prove to be decent shorts (or put plays) on a break of the 50 day. NTGR actually pierced it's 50 dma last Friday which can be a kiss of death even if the stock recovers it by days end. I would place my stop at the breakout price in each case.


Tuesday, January 16, 2007

Fuwei Films (FFHL) looks ready to resume

There weren't too many charts that jumped out at me over this long holiday weekend. Many stocks look like they are in the middle of moves which isn't really the best place to enter a position. ICE for example is certainly looking for a top now that it moved up out of the channel it had been in and looks parabolic (typical of climactic moves). However one decent looking company that just did an ipo about a month ago has a solid chart. There are no options traded on FFHL, but this fast moving Chinese film (materials) technology company looks ready to resume it's uptrend. Of course there is little history to make technical trade decisions based on, however the strength in volume and price following the ipo and the well formed flag consolidation are enough to bring FFHL to new highs in my humble opinion.

As far as their fundamentals, I couldn't find much. From yahoo:
"Fuwei Films (Holdings) Co., Ltd. and its subsidiaries principally engage in the development, production, and distribution of biaxially oriented polyethylene terephthalate (BOPET) films. Its BOPET films are high quality plastic films used in consumer based packaging, such as food, pharmaceutical, cosmetics, tobacco, and alcohol industries; imaging, such as masking films, printing plates, and microfilms; electronics and electrical industries, such as wire and cable wraps, capacitors, and motor insulations; and in magnetic products, such as audio and video tapes. The company’s principal products include printing base films; stamping foil base films; metallization or aluminum plating base films; laser holographic base films; matte films; and high-gloss films. It sells BOPET film products to customers and distributors in the flexible packaging industry. The company markets and sells its products in the People’s Republic of China, the United States, Japan, and southeast Asia. Fuwei Films (Holdings) Co. was founded in 2003 and is headquartered in Weifang City, the People’s Republic of China."

Ps. I have been working on software to interact with the Interactive Brokers API (program interface). If any readers use the IB TWS API or write code to assist in trading on other platforms, I would love to exchange ideas with you about your software.

Sunday, January 07, 2007

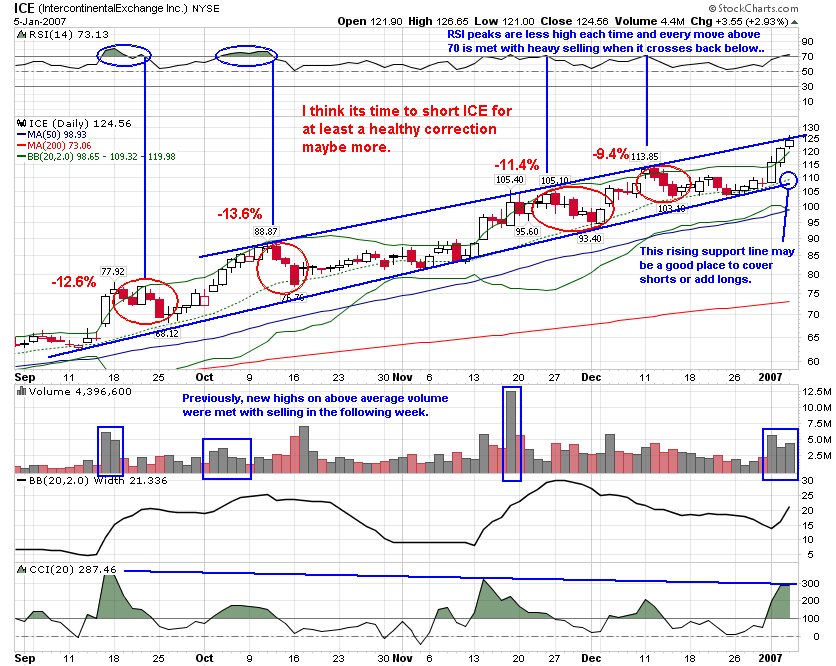
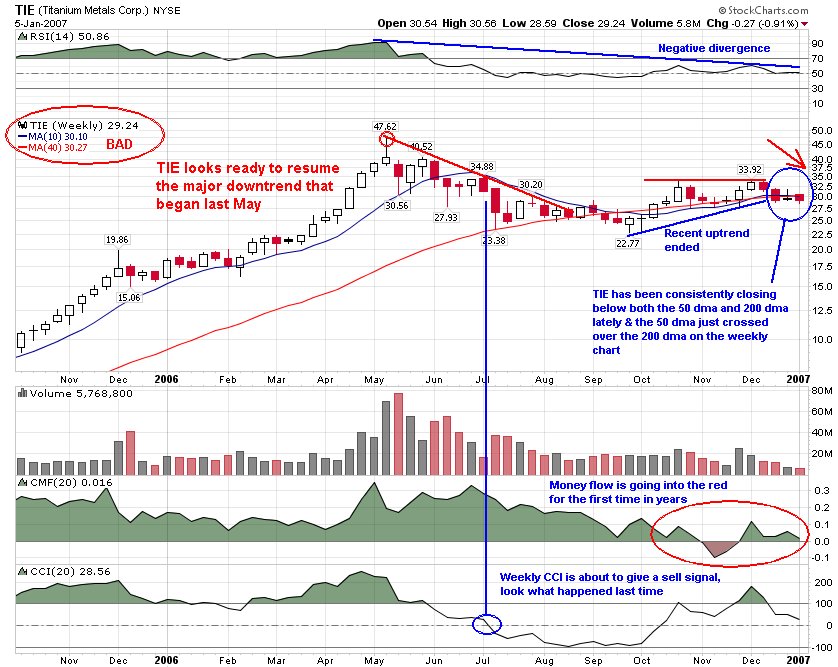
Short-term (ICE), long-term (TIE) and naked shorts (CREE)

I'm gonna let the charts do the talking this week, first a short-term (daily chart) short: ICEA long-term (weekly chart) short: TIE
A naked short (short em even if you can't borrow them): CREE
And a new years bonus short!!: MOS
Happy New Years from Stock Geometry!!!