Sunday, August 27, 2006

Major Money Outflows in GRMN and CME

Note that while CME has broken support and big money has clearly been dumping it lately, the candlesticks alone suggest a reversal on the daily. If I were ignorant of the volume action in CME I would say buy it for a swing trade. I suspect the action early monday morning will set the standard for the week.
*You can always click an image to enlarge.

Sunday, August 20, 2006

Breakout!

Stocks defied all odds last week and broke out of a 4 month long downtrend led by strength in the nasdaq. The lower volume aside, it sure APEARS as though the broader markets wil at least re-test the highs. The rally was more or less based on investor optimisim derived from the perception of a "soft landing" for the economy as opposed to a full blown recession. As sure as everyone seemed to be that the markets would turn lower last week after a selloff on the fed pause, the nasdaq broke it's 50 dma and a downsloping trendline:
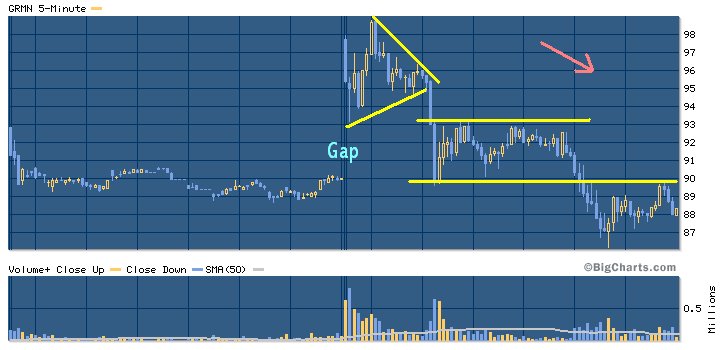
Right now, we have a major breakout on lower volume in a slowing economy. The chart says we go higher and so I would recomend looking for breakouts on individual stocks. Some that I will be following early next week will be LMS, FMD, TNL, GRMN, NITE, DRIV, TRMB, ISE & ICE. Yes that is a long list but there are alot of nice charts right now. As a technical trader I have to look for long set ups in this market, but I will be quick to sell as fundamentally we should break the last few weeks lows in a slowing economy. It may be smart to either hold a large amount cash or hedge your long positions as this breakout could easily fail and reverse. As a possible hedge you might ant to look into VIX (volatility index) calls, this is a bet on a major market decline. Also, histoically the VIX has not been much lower than the levels is at now(which suggests we may be on the cusp of a major decline).
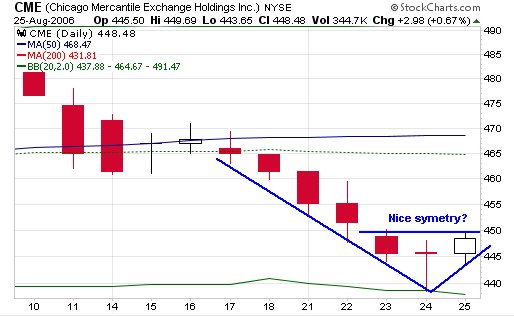
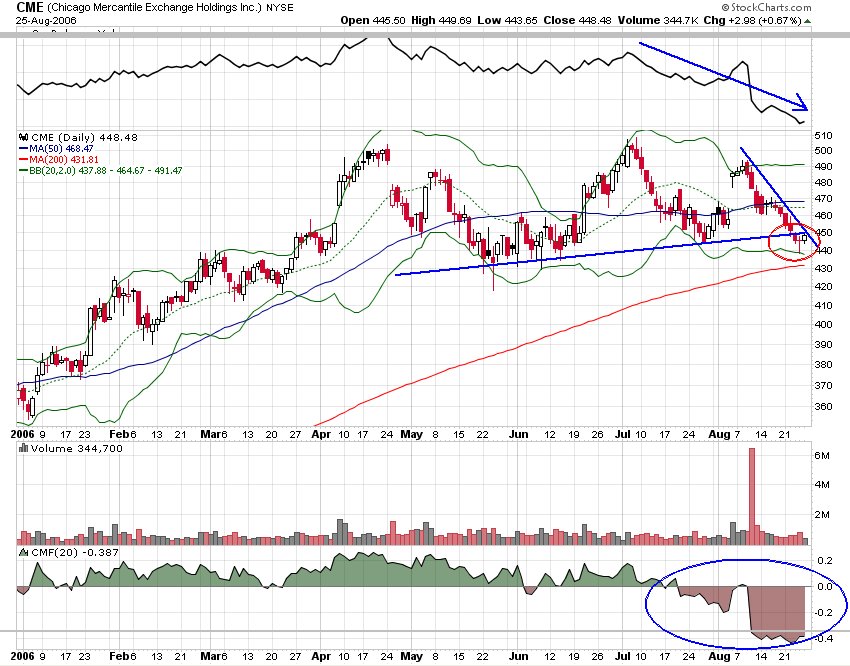
Sunday, August 06, 2006

Broad Market Decline Coming

I see the market averages at a very important pivot point right now with a high downward bias. We have seen strong opens get sold and lower volume on the days when the market closes up, strong indications that institutions are pulling money out of the market. The nasdaq tracking QQQQ have been in a severe decline ever since breaking down in early May. The S & P 500 tracking etf SPY looks a little better but is at strong resistance right now (below).
What does this mean? For one thing I would be very careful on the long side and preffer shorts. Staying out of the market entirely may be a good idea until new direction is found. Many would argue that when/if the fed pauses in their interest rate hike campaign the market will rally, but I would say that it is just plain stupid if the market rallies because the economy is doing so poorly that the fed has to stop tightening. If there is a pop I would be shorting into it and I bet many pro's would too. For that reason I suspect a fed pause to be just another case of buy the rumor sell the news. But this time sell the news then sell with both fists because we are headed into a economic slowdown.

GRMN behaved true to form an sold off all day friday until finding support at 85 at which time i exited my put position (at a nice profit). Then after rallying about 1.5 points they announced a 1.5M share buyback(on 110M shares outstanding which is nothing even when compared with the 1.9M daily average volume) and the stock ran into the close. My personal opinion is that this will present a great shorting opportunity next week when the stock tops out short of 100 (again). AS I said before the GRMN chart reminds me of HOM (now HSOA) just before it craterted 50%. More on GRMN later...

I like IOTN and MOVI long for earnings this week. They do not trade with the market. Happy trading!

Wednesday, August 02, 2006

The GRMN Party is Over

On blowout earnings GRMN gapped higher this morning reaching as high as 105 in the premarket. But as soon as the market opened the selling began in volume and did not abate. GRMN turned out to be a good trading stock with substantial moves all day long but the trend was decisively down. Having bounced twice off the closed gap at 90 GRMN broke that in the late afternoon touching 86 and closing near 88. I will not speculate on reasons for this aggressive distribution I will however speculate that GRMN goes alot lower from here, 80 is still the first target. Here is an hourly 10-day chart to keep the recent action into perspective, note the money flow and engulfing nature of today's trade.

For those interested in options here is today's data for one of the options I traded (aside from selling calls this was the most profitable way to trade the action):

GRMN Aug 2006 $95.00 put (GQRTS)

Last Trade: 8.50
Date: Aug 2
Prev Close: 8.50
Open: 3.20
Bid: 8.50
Ask: 8.90
Day's Range: 2.50 - 10.20
Contract Range: 2.40 - 9.30
Volume: 3,628
Open Interest: 2,088
Strike: 95.00
Expire Date: 18-Aug-06

Disclosure: I currently hold August 90 puts and may purchase some 85's tomorrow.