Saturday, December 23, 2006

Hythiam (HYTM) The stock to own in 2007?

A look at HYTM by StockGeometry contributer Namec:

"Overview from HYTM 10k

We research, develop, license and commercialize innovative physiological treatment protocols designed for use by healthcare providers to treat individuals diagnosed with dependencies to alcohol, cocaine and methamphetamine, as well as combinations of these drugs. Unlike traditional treatment methodologies, our proprietary PROMETA treatment protocols include medically supervised treatments designed to address both the neurochemical imbalances in the brain and some of the nutritional deficits caused or worsened by substance dependence. Changes in brain chemistry and function play an important role in the physical and behavioral symptoms of substance dependence, including tolerance, withdrawal symptoms, craving and relapse. PROMETA represents an innovative approach to managing substance dependence that is designed to address physiological, nutritional and psychosocial aspects of the disease, and is thereby intended to offer patients an opportunity to achieve sustained recovery.

Traditional treatment approaches for substance dependence focus mainly on group therapy, abstinence, and behavioral modification, while the disease’s underlying physiology and pathology is rarely addressed, resulting in fairly high relapse rates. Currently therapies are beginning to target brain receptors thought to play a central role in the disease process. We believe that our PROMETA protocols offer an improvement to traditional treatments because treatments with PROMETA are designed to directly target the pathophysiology induced by chronic use of alcohol or other drugs. Without specific treatment, the abnormalities in brain function induced by chronic drug dependence may take months to years of drug abstinence to return to normal function. We believe the PROMETA protocols offer an advantage to traditional alternatives because they provide a treatment methodology that is discreet, mildly sedating and that can be initiated in only two to three days, with a second two‑day treatment three weeks later for addictive stimulants. Our PROMETA protocols also provide for one‑month of prescription medication and nutritional supplements, combined with psychosocial or other recovery‑oriented therapy chosen by the patient in conjunction with their treatment provider. Initial clinical observations suggest that our protocols may improve cognitive function, reduce withdrawal symptoms, be associated with higher initial completion rates than conventional treatments, and reduce physical cravings which can be a major factor in relapse, thus allowing patients to more meaningfully engage in counseling or other forms of psychosocial therapy. These conclusions were reached during treatment of approximately 400 patients and may not be confirmed by clinical research studies, may not be statistically significant, have not been subjected to close scientific scrutiny, and may not be indicative of the long‑term future performance of our protocols.


We believe the short initial treatment period when using our PROMETA protocols is a major advantage over traditional inpatient treatments and residential treatment programs, which typically consist of approximately 21 days of combined inpatient detoxification and recovery in a rehabilitation or residential treatment center. Treatment with PROMETA does not require an extensive stay at an inpatient facility. Rather, the protocols offer the convenience of a two to three day treatment (addictive stimulants require a second two day treatment three weeks later) and can generally be administered on an outpatient basis. This is particularly relevant since approximately 77% of adults classified with dependence or abuse are employed, and loss of time from work can be a major deterrent for seeking treatment. Moreover, we believe PROMETA can be used at various stages of recovery, including initiation of abstinence and during early recovery, and can complement other forms of alcohol and drug abuse treatments. As such, our protocols offer a potentially valuable alternative or addition to traditional behavioral or pharmotherapy treatments that does not require chronic administration of a pharmacotherapy, thus minimizing compliance issues. Many medications marketed to treat alcohol or drug dependence are not administered until the patient is already abstinent, require long‑term chronic administration and must be taken several times a day to achieve the desired effect.

Substance dependence is a worldwide problem with prevalence rates continuing to rise despite the efforts by national and local health authorities to curtail its growth. Substance dependence disorders affect many people and have wide‑ranging social consequences. In 2004, an estimated 22.5 million Americans suffered from alcohol or other forms of drug abuse or dependence, according to the National Survey on Drug Use and Health published by the Substance Abuse and Mental Health Services Administration (SAMHSA), an agency of the U.S. Department of Health and Human Services. Furthermore, according to the survey, approximately 12 million Americans age 12 and older, or 5 percent of the population, are reported as having tried methamphetamine, and the percentage of methamphetamine use characterized as abuse or dependence doubled from 2002 to 2004. Findings from The Drug and Alcohol Services Information System (DASIS) Report published by SAMHSA’s Office of Applied Studies in September 2004 show that methamphetamine hospital admissions as a percent of substance abuse treatment admissions increased from 1% in 1992 to 7% in 2002.

It is commonly reported that addiction to methamphetamine is an epidemic rapidly spreading throughout the U.S. Methamphetamine addicts are highly resistant to treatment and, even after intervention, relapse at very high rates. Methamphetamine use is also spreading to the workplace. A study funded by the Wal‑Mart Foundation in 2004 determined that each methamphetamine‑using employee costs his or her employer $47,500 per year in terms of lost productivity, absenteeism, higher healthcare costs and higher workers’ compensation costs. For county governments and their taxpayers, methamphetamine abuse causes legal, medical, environmental and social problems. A study entitled “The Criminal Effect of Meth on Communities” conducted in 2005 by the National Association of Counties, which surveyed 500 counties in 45 states, reported that 58% of counties surveyed reported methamphetamine as their largest drug problem, with 87% reporting increases in arrests involving methamphetamine starting 3 years ago. Cocaine was reported as the number one drug problem in 19% of the counties. There are currently no generally accepted medical treatments for cocaine or methamphetamine dependence.


Summarizing data from the Office of National Drug Control Policy (ONDCP) and the National Institute on Alcohol Abuse and Alcoholism (NIAAA), the economic cost of alcohol and drug abuse exceeds $345 billion annually in the U.S., including $41 billion in healthcare costs and approximately $245 billion in productivity losses. Despite these staggering figures, it is a testament to the unmet need in the market that only 17% of those who need treatment actually receive help. Traditional treatment methods are often not particularly effective, especially when it comes to those who are dependent on stimulants. Often faith, willpower, and counseling are the only options available. Compounding the lack of efficacious treatment options is the enormous stigma of leaving one’s life, income, and loved ones for weeks at a time to seek inpatient treatment.

There are approximately 13,000 facilities reporting to SAMHSA that provide substance abuse treatment on an inpatient or outpatient basis. Historically, the disease of substance dependence has been treated primarily through behavioral intervention, with fairly high relapse rates. The DASIS report states that in 2000 only 54% of those treated for alcoholism and 51% of those treated for cocaine and other stimulants complete detoxification, and that combined alcohol and cocaine outpatient treatment completion rates were only 41%. For patients who do complete treatment, the NIAAA reports relapse rates three months following treatment for alcohol dependence to be 50%. Relapse rates are higher for those suffering from cocaine dependence as opposed to alcohol. For the behavioral treatment of cocaine dependence, the Drug Abuse Treatment Outcome Survey reports a relapse rate of 69% one year

Our Solution: PROMETAÔ

Those suffering from alcohol and/or drug dependence have often been characterized as having social disorders or a lack of self‑discipline and, as noted above, there are relatively high relapse rates utilizing conventional treatment methods. While we believe the psychological approach to substance dependence treatment is important, we recognize that physiological factors of substance dependence should be addressed first to provide patients with an improved chance for recovery. We believe our physiological approach, focused on addressing the neurochemical imbalances in the brain caused or worsened by substance dependence, provides a substantial commercial opportunity.

Current research indicates that substance dependence is associated with altered cortical activity and changes in neurotransmitter function, which are critical to brain function. Moreover, changes in the neurochemistry of the brain underlie the hallmarks of substance dependence, including tolerance, withdrawal symptoms, craving, decrease in cognitive function and relapse. Our PROMETA protocols include medically supervised treatments, prescription medications and nutritional supplements, combined with psychosocial or other recovery‑oriented therapy chosen by the patient in conjunction with their treatment provider.

The PROMETA treatment protocols provide for:

· A comprehensive physical exam, including specific laboratory tests, prior to initiation of treatment by the treating physician, to determine if the patient is appropriate for the PROMETA protocol

· Medically supervised administration of prescription medications and nutritional supplements

· One‑month of prescription medications and nutritional supplements following the initial treatment

· Individualized continuing care options


Treatment with PROMETA involves the oral and intravenous administration of pharmaceuticals in a medically supervised setting. The medications used in the PROMETA treatment protocols have been approved by the FDA for uses other than treatment of substance dependence. The PROMETA treatment is discreet and does not require long periods away from home or work. Treatment takes place at a hospital facility, clinic or properly equipped outpatient setting by healthcare providers who have licensed the rights to use our PROMETA protocols. The treatment begins with a two‑to‑three day course of prescription medications and nutritional supplements. The PROMETA protocol for stimulant dependence provides for a second, two‑day course of treatment at the facility, which takes place about three weeks after the initial treatment .Some patients may require an additional day of treatment, subject to the treating physician making this decision during the course of the treatment. In general, the intravenous treatment session typically lasts about an hour. Some patients may receive their treatment in a hospital, or “in‑patient” setting. For these patients, the balance of time spent at the treatment facility or hospital is intended to ensure that the patient is well‑rested and comfortable between the relatively short treatment periods. Most patients take meals and choose to sleep much of the time between treatments. For the patients receiving care in an “outpatient” facility, such as a physician’s office or treatment center, their doctor may monitor them for a few hours following the treatment session. Typically, the patient would then be released to an accompanying person and return the following day for completion of their treatment. Following the medically supervised treatments, our protocols provide that patients receive one month of prescription medication and nutritional supplements, and participation in psychosocial or other recovery‑oriented therapy they select with their physician.

Analysis

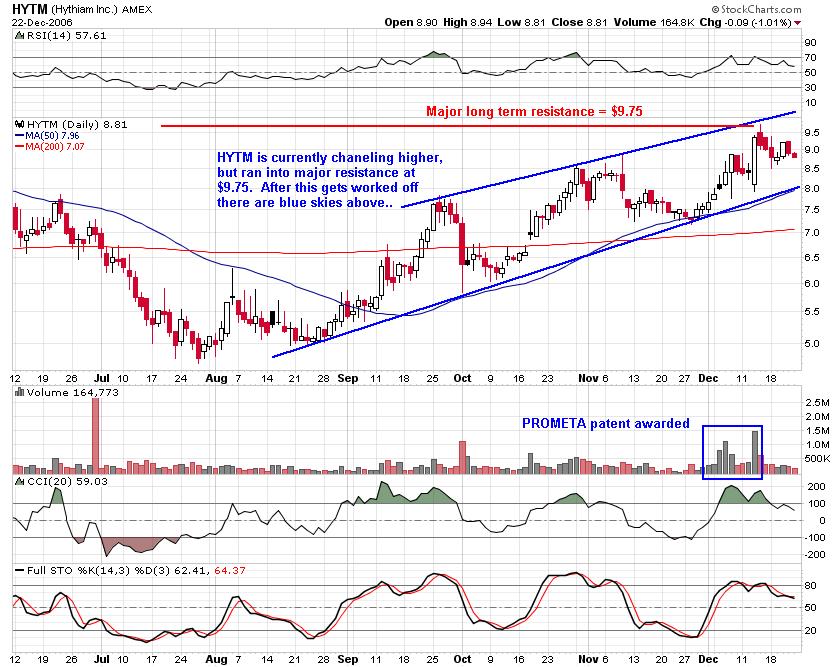
At first glance HYTM appears to be to good to be true. A simple 2-3 day treatment using off patent drugs eliminates the physical cravings of drug abusers. However, the inital studies have produced remarkable anecdotal evidence that PROMETA seems to really work. There are several double blind placebo controlled studies underway that should be completed in 2007. HYTM is charging a lot of money per treatment but the economic cost of drug abuse is staggering. HYTM needs to be on your radar screen because the upside potential plus media attention could be huge. The chart says the market is starting to believe.....

"

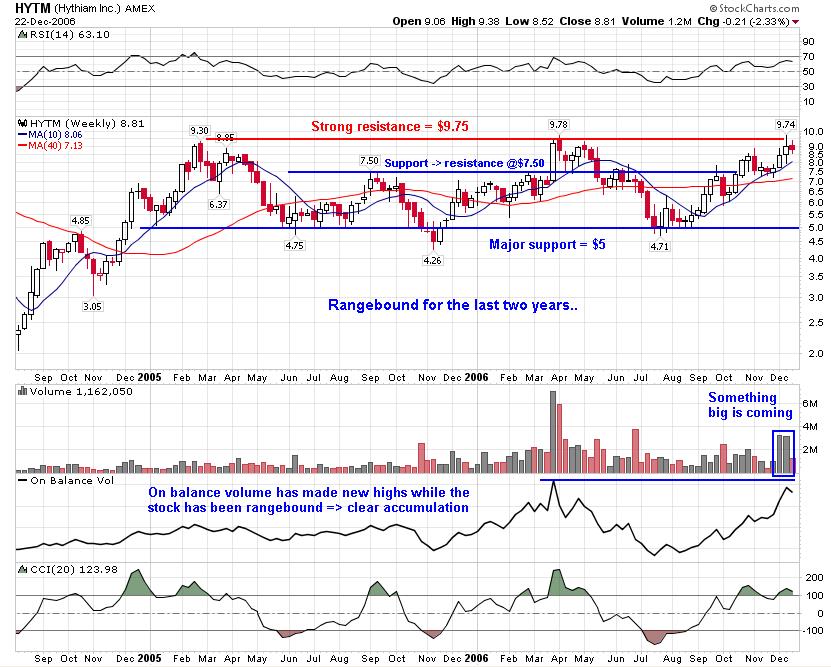
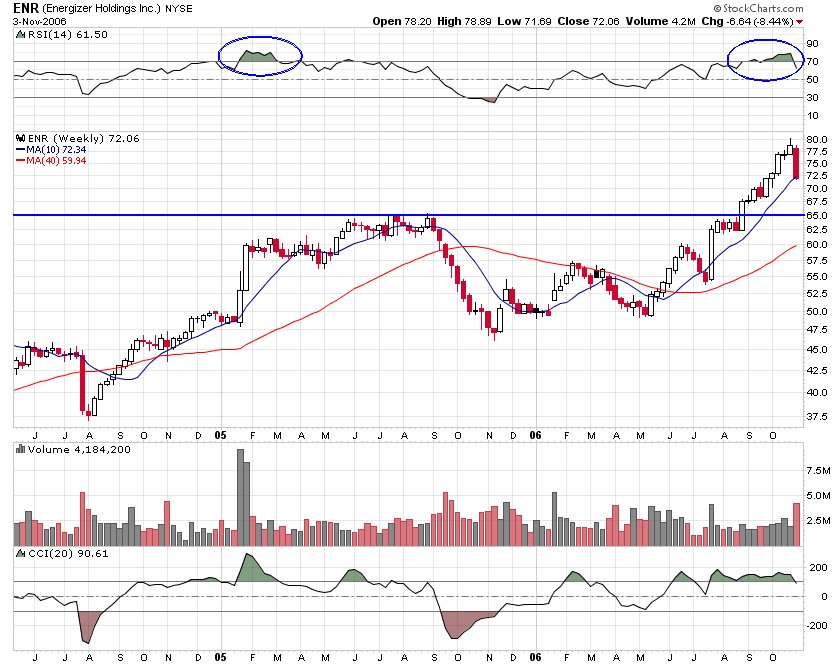
To follow up on Namec's comments, HYTM is in a space that has massive potential with few competitors. With a current market cap of only $350 Million next to a $40 Billion market the grow prospects are obvious. The two and a half year weekly chart above shows HYTM is about ready to breakout of a long period of consolidation. After moving up from the 2$ area HYTM has been rangebound for about two years between $5 and $9.75. On each push up towards resistance the volume has increased and the action has been more well behaved. What i mean by well behaved is how the stock reacts with respect to the moving averages. Specifically, on this last run HYTM held it's 50 dma more consistently than before. Also, the on balance volume has steadily been increasing while the stock has remained rangebound, that tells me the stock is being accumulated. I wouldn't jump into HYTM just yet, but as Namec said keep it on your watch list and watch for a move above key resistance at $9.75. If I see this thing trading at $10 or higher I will be all over a calendar spread on the $10 calls, and yes it trades options. However, if you really like the story you might try picking up shares at the 50 dma, or support at $7.50 if it pulls back that far. Happy holidays from us here at stock geometry!

Sunday, December 17, 2006

Are the CIEN & RBAK Bulls Back?

The networking stocks have been on fire lately, with many names staging breakouts like RBAK and CIEN while others continue to make new highs like CSCO. CIEN had a major correction from the high in May but looks ready to resume that uptrend. On a weekly basis (above) CIEN has cleared the moving averages and the only resistance ahead apears to be the previous peaks following the May high. These resistance levels at $30.87, $33.67 and $33.34 would provide short term targets for those who want to trade it aggresively. In the same sector RBAK has similarly been fantastic and looks destined to reach its previous high at $25. After these recent moves both CIEN and RBAK may need to rest, but this would provide a good entry opportunity. The ideal entry on both would be their 200 day moving average's (dma) but a close below these levels would be a strong sell signal.

The catylist for last weeks breakout was CIEN's 4Q earnings report in which they showed a profit for the first time in 5 yrs. RBAK's catylist was a contract from a Chinese telecom providor to provide broadband equipment for IPTV on top of the CIEN report, and CSCO buyout rumors. Both companies are benefiting from a worldwide boost to increase bandwidth which is a trend I wouldn't expect to dissapear anytime soon.

On a less bullish note, ENR looks ready to make the next leg lower. After a bounce from the $65 area ENR looks ready to test its 200 dma which I expect to be in the lower 62's when it gets there. There is also some chart support at $62 so this is where I would expect it to bounce next.
Happy holiday trading!

Sunday, December 10, 2006

Massey Energy (MEE) and Oil Priced in Gold

That inverted Head and Shoulders (H&S) I mentioned on coal company Massey Energy (MEE) completed a few weeks ago and the chart couldn't look better. Last week MEE formed a textbook bull flag and looks ready to resume the uptrend early this week. I like this well behaved stock and it has plenty of room to run to get back to the former highs. Next week it should pop as it fills a small gap made back in late July, see the chart for more color:
As you know I am quite bullish on energy after oil bottomed and in fact many oil stocks have been making new highs lately. For those who might argue that oil is only going up because it is priced in US dollars which have been very weak lately take a look at the chart below. I have USO (oil etf) divided by GLD (gold etf) which effectively gives you oil priced in gold. You will see a clear break of the downtrend there and what looks to me like much more upside ahead. Also, more on the decline in the US dollar later this week.
For those of you who are here looking for options expiration (friday) trades I suggest you focus very closely on the exchanges sector. I suspect ICE puts will be the trade of the week, but I have clearly been wrong on ICE lately. NYX has been closing at the lows almost everyday since it last made a new high and a top is blatantly obvious to me there. NDAQ has formed a small H&S on it's daily that will complete on a close below 36 (also the 50 dma). And ICE, well the chart looks pretty bullish, but I think the excitement over the vote after the close monday to merge with the NYBOT is way over done. In the least i would expect this to be a sell the news play and in the most it could start to drop fast monday morning and not look back all week. Thats just my gut feeling, you have too many people banging the table for $120 on expected news. Also, take a look at the open interest on the dec ICE options, there will be downward pressure from all those calls 95$ and up that recently went in the money. Im not a big believer in max pain theory, but max pain will certainly be lower than ICE currently trades.

disclosure:
I own ICE puts and MEE calls.

Sunday, December 03, 2006

Oil Breaks Out, Exchanges Top, Broad Distribution

So I think the charts pretty much speak for themselves but I have a few comments to add. Be sure to click on each chart for a better veiw of what is going on. I would now say that oil is definately in a confirmed uptrend until USO breaks below it's 50dma, this means buy energy stocks. My favorite charts in the sector are MEE, BTU, MRO, XTO, CVX and the etf's XLE and OIH. But to be honest every energy stock i look at has an awesome chart.

Last week the exchanges saw some major selling after a huge run-up of the entire sector. The worst hit were NDAQ, NYX, NMX and ICE. The New York Stock Exchange (NYX) for example, made a parabolic run through 100$ on speculation that the merger with european exchange Euronext would be approved. Par (100) had made a good target but it was met with major selling and now there are a ton of new NYX holders in the red. In the very least the stock needs to pullback to a support zone near it's 50dma around 85$. I don't expect the previous high just over 90 to hold, but it may provide an intermediate bounce.
The weekly ICE chart below looks like it may have formed it's second major top since the IPO. Many aspects of the chart look similar to the last peak. I would target the 50 dma first then a rising trendline currently around $75.
With the exchanges leading this market higher for weeks as oil went lower the broad indicies had a major run higher. With the leadership being taken out and oil reversing the dow, s&p and nasdaq all saw a major week of distribution. I don't want to speculate too much here other than to say watch for more signs of weakness as this market may be forming a top or at least correcting.

Disclosure: I own NYX puts.

Sunday, November 26, 2006

Three Breakout Setups: BBY, CHS & MEE

Well it looks like we got the strongest black friday in years and retail should be strong next week, that includes EBAY btw. I think those dec RTH 100 calls are still a good play on that strength, or just buy Best Buy (BBY). BBY looks like it could easily complete a long term cup with handle soon, the trigger is a close above 58$. Check out this weekly chart, the cup n' handle breakout is one of the most profitable patterns out there:
Fundamentally, I think this will be a very good season for Best Buy for a few reasons. Obviously there is a big buzz around the game industry right now and they seem to have cornered the nintendo wii market. I tried to get a wii at my local best buy last week and today. They had 100 on the launch and 70 this morning on the second shipment. Since I didn't camp out I was not able to pick one up on either occasion like many many others even though i was there before the store opened. I did however end up buying a bunch of dvd's for x-mas presents... This compares with my local GME. They had twelve wii's on the launch day and one, yes one on the second shipment. Plus the whole issue surrounding used games that i keep talking about with GME doesn't exist with BBY. Another reason is this new best buy rewards program they have going this year. I am a memeber and without going into details let me just say that I think it will be very effective in gaining market share this year.
Another possible play this week on retail is Chicos, CHS. They report earnings after the close on tuesday, so like JWN wait until wednesday morning to jump in if they impress. The chart is set up for a nice breakout if it can move above 25$ on this report. So I would buy the 25$ dec or jan calls on wednesday morning about 15 min after the open if it gaps up and moves over 25. Oh and by the way, congrats to those who took my advice on JWN. That stock moved as expected and made new all time highs in the lower 50's last week after reporting. Here's a fun fact, Nordstroms's (JWN) only has two sales a year and neither occurs duing the holidays. They get the surge in shoppers on black friday like all the other retailers, but they don't have to pay for it with major discounts. That is one well run company, imo.

I also still like ADM long for a swing trade, it seems to have found support. That stock will move like Deere (DE) once people realize they are profiting off the corn spike as well (why DE has been so strong). Also, here is a random energy stock chart that I like alot, especially if we get a move in oil (which I have been expecting). The buy trigger on MEE is 26, as close above this price will complete a perfect inverted head and shoulders:
Remember, if you miss the breakout look for a throwback to the breakout price intraday or in the following weeks. The odds of getting a throwback depends on the pattern, statistics can be found in the links above. Don't chase a stock that you have clearly missed the boat on. Good luck, and congrats on those ENR profits! -pyth

Saturday, November 18, 2006

Ride the Retail Train

To follow-up on indigo's post last week I'd like to think about a few ideas for the holiday rally. First of all we are in a very strong market heading into the santa claus rally time frame. It is widely expceted that consumers will be eager to spend spend spend this christmas in celebration of lower gas prices (lower than 6 months ago) and higher wages (yoy). How will they spend their money?In the the retail apparel sector I like JWN and they post earnings monday after the close. They will undoubtably beat expectations and raise guidence as they always do. JWN is the best retailer and I speak from experience, if you have ever been in one you know what I'm talking about. That being said, the premium on the calls is too high to try and buy them ahead of earnings and why take the risk? I would recomend buying JWN (calls) at the open tuesday assuming the numbers are good enough to get JWN over $49 as a close above this price would make way for the next leg by completing the bull flag. The chart (above) couldn't be more bullish, pull up a weekly if you like the daily.
For a more conservative play on a booming season for retail buy dec or jan RTH 100 calls. RTH is the retail index etf that includes names like best buy (my fav), home depot and also clothing retailers. While the etf has not been able to hold above 100 on recent moves into this new territory, it looks poised to call par ($100) support soon.

The video game industry is in the midst of a boom phase in that cylce with three new consoles on the market this christmas. Unfortunately, Sony (SNE) had manufacturing problems, Microsoft (MSFT) sucks and Nintendo is only traded on the japanese exchanges. As I mentioned a few months back I don't like the brick and morter game shops because the new consoles enable players to download old games online rather than buy the used ones stuck in GMR's inventory. But what about ebay? For one thing they will benefit from the fact that the new nintendo system and the playstation both play games from older systems (used games). Then theres the half of all those people waiting in lines to get the sold out consoles that put theirs up for sale online for double, triple or in some cases much more on their money. It might be interesting to find out what the turn over rate is on consoles as ebayers try to flip consoles online at the peak demand closer to christmas. This is just one reason I like ebay, indigo pointed out a few of the others last week so see his post. The stock broke out of that ascending triangle and has plenty of room to run. I will be taking at least some profits on my calls around 37.50, the declining trendline from previous highs.
I will try to update the post during the week with links. Happy trading! -pyth

Tuesday, November 14, 2006

EBAY, preparing for lift-off?

As we approach the Christmas shopping season I like to look over the specialties retail plays, internets in particular, for chart positions that I like. AMZN and EBAY are the two that always come to mind. AMZN had it's pop after earnings so I've turned my attention to EBAY.

The short term chart is an ascending triangle that is displaying some obvious intra-day buying. Those upper candle wicks are a sign of buyers that are being sold to, so I went looking for the sellers. I found some of them among the November calls that expire this Friday. This is the maxpain effect at work. As there is no corresponding open interest among the puts, the closing of these calls is acting as an anchor on the stock price.
In my opinion, this ascending triangle couldn't be better formed. It will be broken, and soon, one way or the other. If the call trading takes the stock to $30, the maxpain point for November, the triangle will be broken to the down side. If this solid buying continues, we'll break out to the upside as early as monday, after the options related trading subsides.

With Christmas shopping just around the corner I am sure that EBAY will be doing all they can to provide press releases on their listings and transaction numbers so I'm taking the slightly longer trade. I bought the December $35 calls today at 50 cents.

Update: As of Saturday, November 18 this stock has broken out to the upside of the ascending triangle and held above the previous resistance. Late Friday trading was generally positive and the stock touched $34 in after hours trading on reasonable after hours volume.

I'm excited about the prospects for the stock, come Monday.

Sunday, November 12, 2006

Alternative Energy, I like PBW and ADM

I have been bullish on oil since USO apeared to bottom a few weeks ago. That hasn't changed and in fact many oil stocks have clearly bottomed and are moving up quite well. As you would expect, alternative enrgy stocks have mirrored this move to some degree but most of those stocks corrected very harshly after huge gains early this year. There is so much technical damage that ethanol stocks, for example, still trade below their 200 dma and some like ADM even trade below their 50 dma's. I think that this underperformance has provided a great opportunity in that sector especially in light of the democrat's return to power in the house and senate. While we shouldn't necissarily expect legislation to change dramatically we can expect the buzz around alternative energy to grow as the lawmakers hold hearings and complain on tv. I thought these top ten predictions on the impact of the elections were intertesting and probably correct. The first being that energy will go back up. For a great screen of ethanol, solar and all other energy stocks look here.
In the sector I like the alternative energy etf PBW, seen in the first chart above. Any move above 18 would complete the head and shoulders bottom and set up a run to the highs around 24. However, watch for false breakouts as this has happened twice recently. I wouldn't worry so much about this though because these breakouts occured while oil was in free fall, the USO plot is included for a comparison. PBW is nice because it is diversified among various alternative enrgy areas with an emphasis on solar which has been strong lately. I also like Archer Daniels Midland Co. (ADM) which has been getting reamed lately due to a spike in corn prices (which they actually are hedged against). ADM is making a killing off the ethanol boom as they are the leader in this sector. Higher corn prices are bad for their ethanol business but since they are also into corn processing and other agricultural services like storage and transportation they are well hedged and if fact should profit from an increase in corn prices. The chart (above) looks pretty bad, and if ADM was not such a solid company at a booming time for them I would have a hard time pulling the trigger. The ethanol sector is hot right now, and ADM is too cheap to not buy.

disclosure: I have ADM calls.

Sunday, November 05, 2006

ENR is Out of Juice (luckily its downhill from here)

Energizer was a stock that kept on going and going... but no battery lasts for ever. ENR got into one of those grooves every long craves, a parabolic price increase. After moving out of a less steep uptrend at the end of July on yet another earnings beat ENR acclerated upwards. The stock attempted to top a few times but the dow's strength gave it's sails wind and ENR squeezed higher.
ENR remained overbought from the begining of September until last week when it topped just over $80 then reported a horrible quarter in which they saw profit fall 25% over last year, while revenue increased only 5%. For the year they showed a decline of 7% profit, in otherwords they are not exactly experiencing the robust growth (30% in the month up to earnings) that the stock price had been suggesting. Furthermore, ENR made an appearance in the upper IBD 100 for three weeks but came off this weekend and Morgan Stanley initiated with a sell rating last week before earnings. As mentioned a few weeks ago, I have been watching ENR and waiting for the trend to end before entering shorts (puts in my case). Well the time has come, my first target is weak support at $70 then there is some very strong suport on a rising trendline that had been resistance that currently lies around $65. Then beyond that the 200 dma should be very strong support currently at just under $60. This is one of the best looking shorts I have seen in a while with a close just below it's 50 dma on friday with heavy volume, ENR should be getting sold all week long. Here's a weekly 2.5 year chart to give you a feel for how ENR has behaved in the past, it also suggests $65 is a good target.
In addition I still like the energy sector and am holding some HAL calls. Many energy stocks have great charts and look ready to breakout like XTO or already have like CVX. However there are some quality names that have yet to recover that are looking very attractive like ADM and LNG. Also, keep an eye on the gold and mining stocks, they seem to have begun a new uptrend, I still like GG.

Disclosure: I have HAL calls and ENR puts. Email me if you want to know which contracts.

Tuesday, October 31, 2006

Even if oil didn't bottom today HAL is running.

Did oil bottom today, on this last day in october? It did make a new low, but reversed and actually closed higher for the day. The chart above includes many striking features. I'll point out a few that you might find interesting. The 50 ema has never crossed below the 200 ema on any oil chart going back 3yrs until recently. Similarly, the RSI hasn't gone below 20 and the MACD hasn't seen as low as -3 on any chart I can find. These events occured in mid september right about the time USO made a new volume high above 3M shares traded and closed at the low of that day. Here we are today with a new low and a new volume high of almost 4M shares, but this time we had an up day. Both the RSI and MACD have bottomed and suggest that oil should be almost through. Today may be the capitulation needed. Take a look at HAL compared with the oil etf USO. It broke out last week as expected, then formed a bull flag and is now headed straight for that 200 dma just under 35. Note the price action relative to it's 200 ema (green line) compared with its 200 dma (red line). Also, fibonacci analysis of this move suggests a target near 35. Happy Halloween everyone!
This is what HAL looked like on my screen intraday when it broke out last tuesday, it was easy money from this point on. Happy Halloween everyone!

Sunday, October 22, 2006

HAL Should Have a Great Week

Halliburton, the oil service company released earnings this Sunday that beat wall street expectations in both revenue and EPS(earnings per share). HAL said third quarter earnings were .58c per share on 5.8B in revenue while wall street expected .54c on 5.52B. This represents EPS growth of 22% and revenue growth of a 19%. Now there has been alot of talk lately about a rotation into more conservative large cap stocks out of smaller caps and commodity related companies. Well this 30B market cap has a PE of about 12 on 20% growth, a 1% divdend and a 2B$ stock buyback program. In other words I expect there to be some major fund buying in HAL next week after it has been neglected for months. Lets take a look at the chart:
As you can see, there is some pretty serious resistance just above HAL's closing price last friday. I would expect HAL to gap above this resistance around 30 and run all week heading for that 200 dma before a pullback.

For comparison, here is how HAL behaved last year on a similar earnings beat with around .40c in EPS. As you can see the opening price would have been a great place to go long even after a sizeable gap. The key is for HAL to gap close to or above and hold $30.30. I would consider the nov 30$ or 32.50$ calls, maybe the dec 35$'s depending on your time horizon.

Analyst Info

Sunday, October 15, 2006

Looking for the Energy Bottom

With a so much credit for this bull market due to a major pullback in energy prices it will be important to keep an eye on crude in the coming weeks. A further decline in crude prices should fuel, no pun intended, further stength in the dow (DIA) and S&P 500 (SPY) while a reversal would have the opposite effect. Currently light sweet crude is in a decending broadening wedge. This weekend I found a very useful site run by Bulkowski based in his books, check it out. Watch for that upper trendline to break, thats when i would look at longing some beaten up oil stocks like ADM or the OIH, not they have already begun to moke back up.

There is no denying the magnitude of the bull market in stocks we have right now. Here are a few awesome looking breakouts in stocks that surprised me:


At some point patient traders will make a killing shorting this buying frenzy. One stock that is looking a little top heavy is Energizer (ENR). If you spot a confirmed reversal I think it could give back much if not all of this recent parabolic move:

Sunday, October 08, 2006

Time to load up on Gold?

So, it looks like North Korea may now be among the nuclear weapons club. While it has yet to be confirmed, this is still going to be all over the news tomorrow and I expect we will see "official statements" about it all day long. Its hard to estimate exactly how serious this news will be for the markets but we did have clear signals from China, Japan and North Korea last week that a nuclear test would be "untolerable." Yes, China. While I wouldn't expect this news to plunge Asia into a war it certainly does increase the instability in the region and worldwide. Now I am no commodity expert but I can see the obvious connection between global instability and gold. In general gold is considered a very safe place to put money, especially instead of say South Korean currency in the event of a war. So my money hungry mind pulled up this 1 year gold chart (etf):
Gold is currently in a downtrend being below it's 50 dma, 200 dma and declining trendline. However, gold did find strong support last week and apears poised to at least test that trendine. The technical picture coinciding with the North Korea news may bode very well for gold. I wasn't surprised to see gold up very strongly overnight in Hong Kong and Sydney exchanges. To play this on a US exchange you can either trade the gold etf GLD or I would recomend considering a beaten up gold procucer like Goldcorp GG. If gold begins a new uptrend GG should move up fast. Recent aquisition issues have made GG cheap, AUY is also good if you preffer.
Is it time to load up gold, in my opinion: YES!

Sunday, October 01, 2006

CROX, CREE and SHLD

Last week was great for the fad shoe company CROX. Not only did they get pumped by cramer multiple times but they were added to the S&P SmallCap 600. This action has taken CROX almost up to the previous high that was made on a very sharp reversal day when they last raised guidance. I suspect many have been buying in anticipation of a similar raise in guidence this quarter by the ugly shoe company. And then what? Last time they did that CROX gave up all the gains and then some followed by a sharp decline. I think most would agree this compnay is going to be a fantastic short but the problem is in deciding when to enter. The stock is already heavily shorted and it nearly at the highs. Short squeeze aside I think now is the time to enter CROX shorts. Set a tight stop loss at 35 and ride this one down to at least 30 in the short term.

CREE is a stock that I have follwed for a while and shyed away from after the company repeatedly disappointed me. I was always excited about the short squeeze that never happened and I eventually realized they were right all along. I know a fair amount about the company and their technology so let me know if you want more background. I bring CREE up becuase it is at a pivot point. Most people would probably look at this chart and say you should long it for a gap fill, but keep in mind that gaps also provide support/resistance. The recent run is encouraging for longs but in the context of a broader rally in semiconductor stocks it has actually underperformed. From here at the upper end of it's range I think you could get at least a few points out of a short perhaps more if the support at 18 fails and it has twice recently. Set your stop just above entry and be mindful of the possibility for a quick gap fill up to 22 (an even better place to enter or add).


And another double top in SHLD. Ride it down to at least the upsloping trendline and set your stop around 165.
By the way, what I am calling double tops could quickly become double top breakouts. If these stocks start making new highs on above average volume be sure to cut your losses short. At these pivot points you have a low risk entry. Also, GS has not been able to move higher since last week but has not reversed either. It takes courage but I think it is going to be a great short when the wind comes out of the financial sector's sails. NVDA has confirmed the top on volume and has started moving back down. If you went short last week you are making money.

disclosure: I have CROX Oct 30 puts

Sunday, September 24, 2006

Double Tops Galore

If these stocks can move much higher I would suggest going long or cutting short losses. But now might be a good time to enter shorts at least for a swing in GS and NVDA. There is a plethora of potential double tops out there see SPY for example.

I will add more double tops here later in the week, happy trading!

Sunday, September 17, 2006

OIH Broke But is Due to Bounce

My braoder market view still holds, see the long term weekly chart in the S & P 500 tracker above. While there is some room for the overall market to move higher, I suspect not much. The dramtic fall in oil has caught me off guard and so I am very cautious in this market. A safer play would be to short the oil and commodity stocks on a bounce. I do feel that the energy stocks have moved down too quickly and playing a bounce long might be worthwhile. The OIH (oil services index) seems to have found some support at 124 and a throwback to the breakdown point is common. In this case that would take the OIH back up to 130 which is the ideal point to enter shorts.
I like CVX for a bounce play because there is a gap that needs to be filled and you will have a tough time finding an unfilled gap in CVX.
Also, my opinion of TIE still stands, if you went short last week above 25 you are in a great position in my opinion. As far as CME, the gap caught me by surpise as I'm sure it did many. While the recent action in the broker/dealer sector (see ICE, BOT, ISE) does have me concerned I plan on holding my CME puts at least a little longer.

disclosure: I hold CVX oct 65 calls and CME oct 440 puts

Monday, September 11, 2006

TIE Just Ran Into an Asteroid

I normally don't post on mondays but I feel bad having not spoken more about TIE in this weekend's post. As I suggested it might, TIE broke support today (following it's failed breakout) on strong volume and closed very poorly. I think this is easy money which is hard to come by on an options expiration week. Fortunatly, I already had Sept 25 puts from last week which I quickly took profits on when TIE found support at 25. However, it had broken its 200 dma for the first time in years so i watched it closely all day until it re-tested and broke 25. When this occured I did not hesitate to buy back my puts higher and I may even jump into 22.50's tomorrow depending on how it opens. This sets up TIE for a move to at least 20 most likely much lower. If you think the short juice has been squeezed out of TIE already just take a look at this logrithmic 2 year chart. I don't think so!
Ps. For those who know what I am talking about when I refer to TIE as if it were a space vehicle, tomorrow the original trilogy FINALLY comes out on dvd. Yes, the Solo shoots first, CG free, proper ewok finale version is set to be released tomorrow. You can guess where some of my TIE profits will be going!

Sunday, September 10, 2006

Its Time to Enter Long Term Shorts (and a few ideas)

Well, the rising wedge in the S&P 500 I spoke of last week did break to the downside on the return of volume as expected. With the return of volume I have seen many previous breakouts return to or below their breakout point (TIE for example) . Other stocks are hovering at support but are not oversold on their relative strength (CME for example). We have what looks like a long term top in all the market averages coupled with a seasonally weak period for the market. Most previously leading stocks are off their highs but can move potentially much lower without falling much from their current levels (by breaking support). In short (no pun intended) the market averages look like houses of cards ready to make a substantial move lower. I believe support levels will be broken in the next two weeks, most likely after the triple witch (op ex) friday. But I wouldn't discount a meltdown next week even though there may be a fair amount of end of quarter support (many funds would like to see their books show the recent gains). I have talked alot about GRMN and CME lately, lets take a step back and look at their weekly 2 year charts (like the SPY chart above):
As you can see in both of these charts there is massive potential downside in these former IBD favorites that have put in a top. I will be looking for opportunities to add to my long term short positions in both of these next week. The ideal entry in CME is 450-460$, for GRMN anywhere up to 45$ is good. Based on their charts I think the time is right to enter both of these for the impending bear market.

Monday, September 04, 2006

A Few Good Longs and a Wedge

While the S&P 500 (above) seems to be tracing out a textbook rising bearish wedge with volume decreasing as the range converges many stocks look to move higher. I share a similar view on the market as market observations. Mainly I will wait for volume but this rally feels like one last squeeze on the shorts and an opportunity to trap longs before the bear market sets in. I'm looking for an obvious double top in the SPY with some captulation at the highs. I don't expect the NASDAQ to make it that far. Some decent looking stocks that I would long while the market tries to follow through in the short term are TIE, CME and CAT.