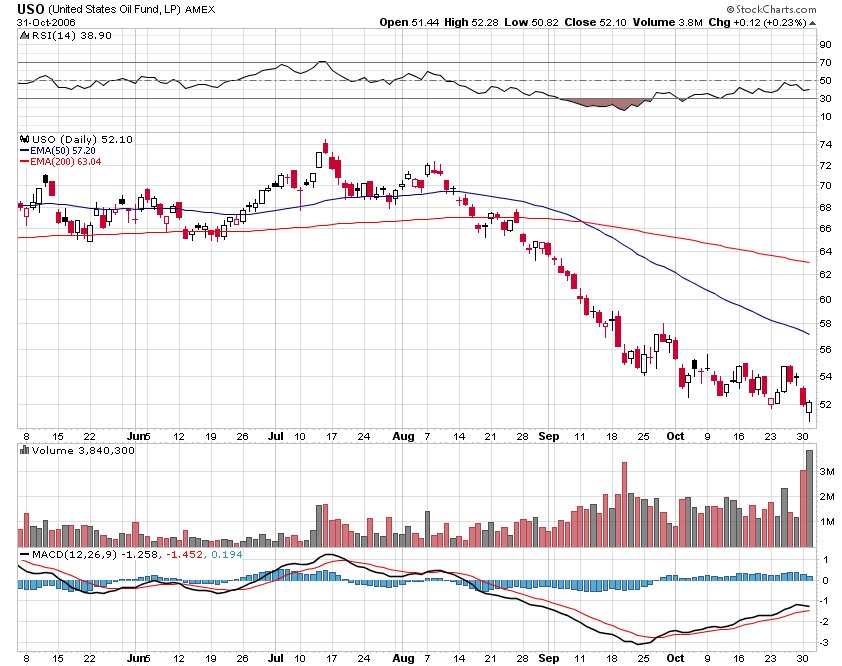
Did oil bottom today, on this last day in october? It did make a new low, but reversed and actually closed higher for the day. The chart above includes many striking features. I'll point out a few that you might find interesting. The 50 ema has never crossed below the 200 ema on any oil chart going back 3yrs until recently. Similarly, the RSI hasn't gone below 20 and the MACD hasn't seen as low as -3 on any chart I can find. These events occured in mid september right about the time USO made a new volume high above 3M shares traded and closed at the low of that day. Here we are today with a new low and a new volume high of almost 4M shares, but this time we had an up day. Both the RSI and MACD have bottomed and suggest that oil should be almost through. Today may be the capitulation needed. Take a look at HAL compared with the oil etf USO. It broke out last week as expected, then formed a bull flag and is now headed straight for that 200 dma just under 35. Note the price action relative to it's 200 ema (green line) compared with its 200 dma (red line). Also, fibonacci analysis of this move suggests a target near 35. Happy Halloween everyone!
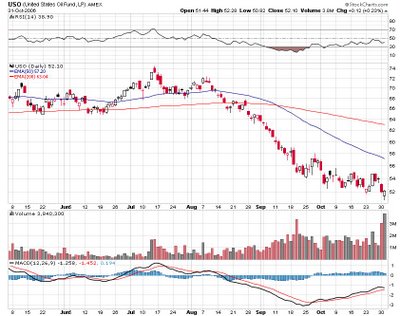
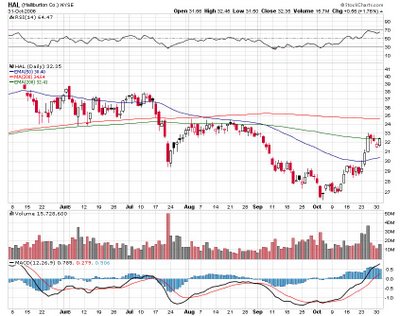 This is what HAL looked like on my screen intraday when it broke out last tuesday
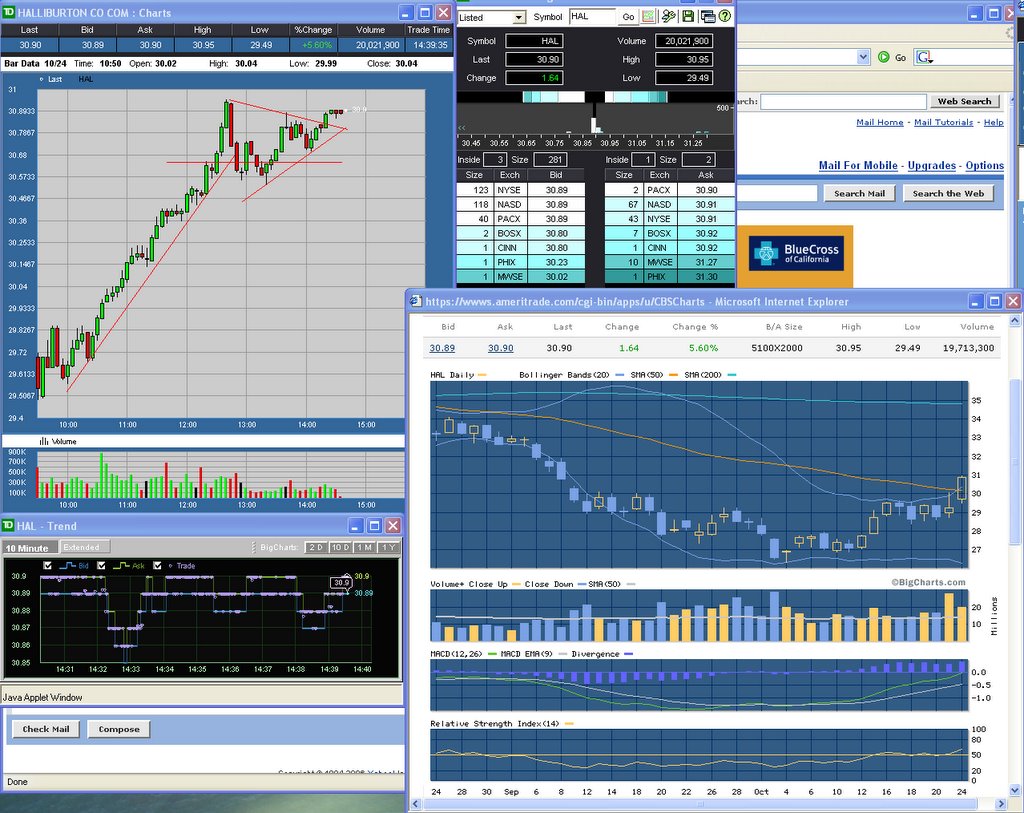
, it was easy money from this point on. Happy Halloween everyone!
 Did oil bottom today, on this last day in october? It did make a new low, but reversed and actually closed higher for the day. The chart above includes many striking features. I'll point out a few that you might find interesting. The 50 ema has never crossed below the 200 ema on any oil chart going back 3yrs until recently. Similarly, the RSI hasn't gone below 20 and the MACD hasn't seen as low as -3 on any chart I can find. These events occured in mid september right about the time USO made a new volume high above 3M shares traded and closed at the low of that day. Here we are today with a new low and a new volume high of almost 4M shares, but this time we had an up day. Both the RSI and MACD have bottomed and suggest that oil should be almost through. Today may be the capitulation needed. Take a look at HAL compared with the oil etf USO. It broke out last week as expected, then formed a bull flag and is now headed straight for that 200 dma just under 35. Note the price action relative to it's 200 ema (green line) compared with its 200 dma (red line). Also, fibonacci analysis of this move suggests a target near 35. Happy Halloween everyone!
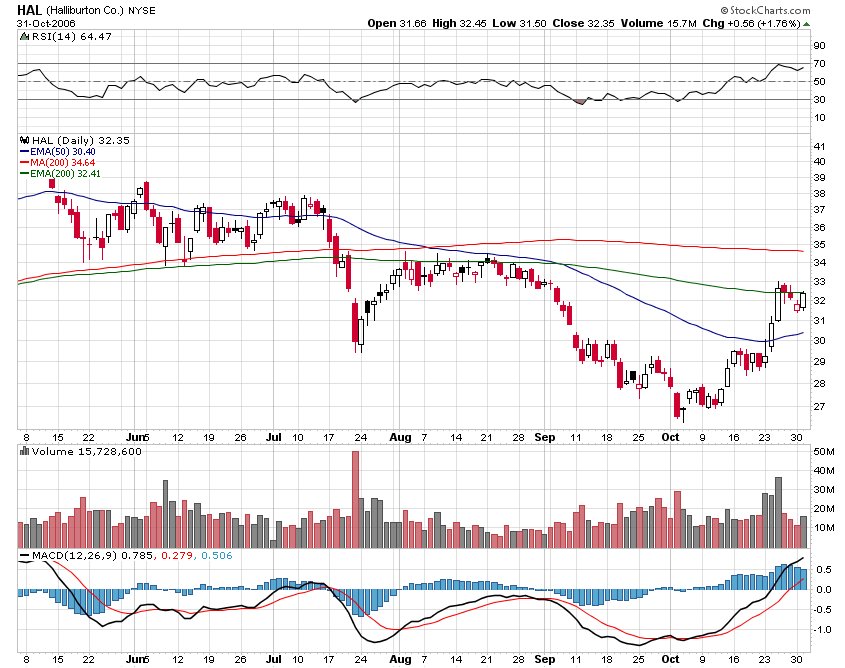 This is what HAL looked like on my screen intraday when it broke out last tuesday, it was easy money from this point on. Happy Halloween everyone!

No comments:
Post a Comment