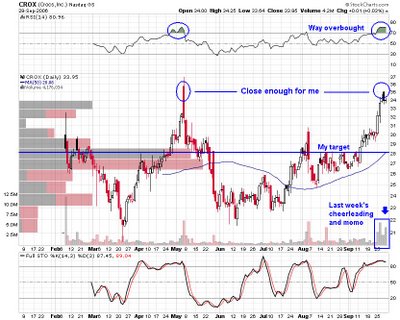
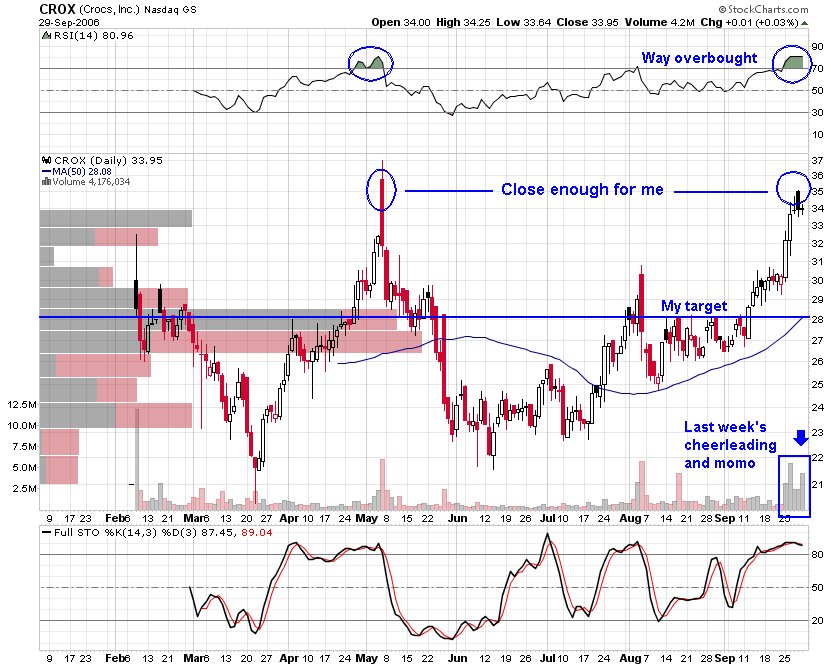
Last week was great for the fad shoe company CROX. Not only did they get
pumped by cramer multiple times but they were
added to the S&P SmallCap 600. This action has taken CROX almost up to the previous high that was made on a very sharp reversal day when they last raised guidance. I suspect many have been buying in anticipation of a similar raise in guidence this quarter by the
ugly shoe company. And then what? Last time they did that CROX gave up all the gains and then some followed by a sharp decline. I think most would agree this compnay is going to be a fantastic short but the problem is in deciding when to enter. The stock is already heavily shorted and it nearly at the highs. Short squeeze aside I think now is the time to enter CROX shorts. Set a tight stop loss at 35 and ride this one down to at least 30 in the short term.
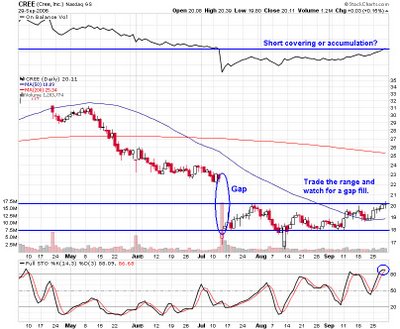
CREE is a stock that I have follwed for a while and shyed away from after the company repeatedly disappointed me. I was always excited about the short squeeze that never happened and I eventually realized they were right all along. I know a fair amount about the company and their technology so let me know if you want more background. I bring CREE up becuase it is at a pivot point. Most people would probably look at this chart and say you should long it for a gap fill, but keep in mind that gaps also provide support/resistance. The recent run is encouraging for longs but in the context of a broader rally in semiconductor stocks
it has actually underperformed. From here at the upper end of it's range I think you could get at least a few points out of a short perhaps more if the support at 18 fails and it has twice recently. Set your stop just above entry and be mindful of the possibility for a quick gap fill up to 22 (an even better place to enter or add).
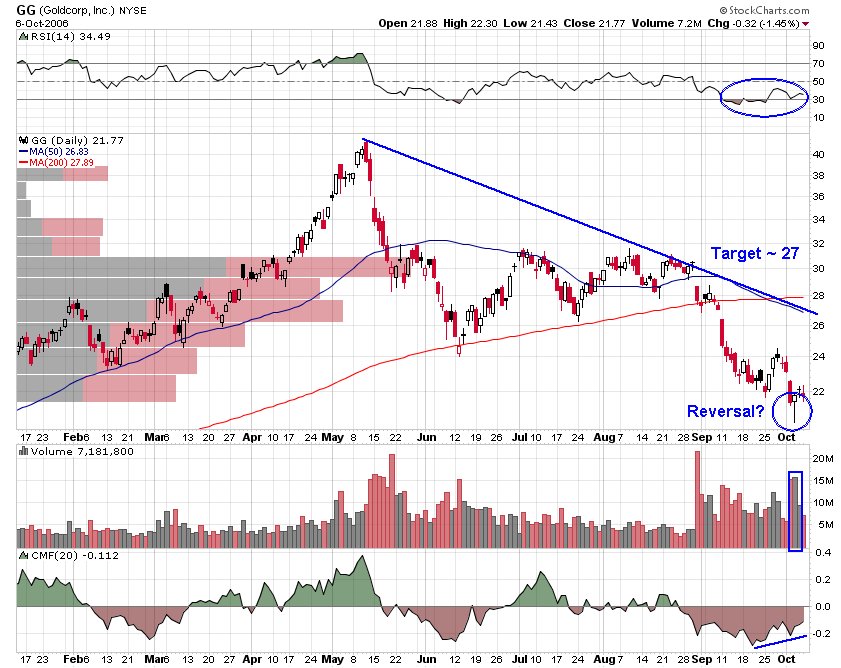
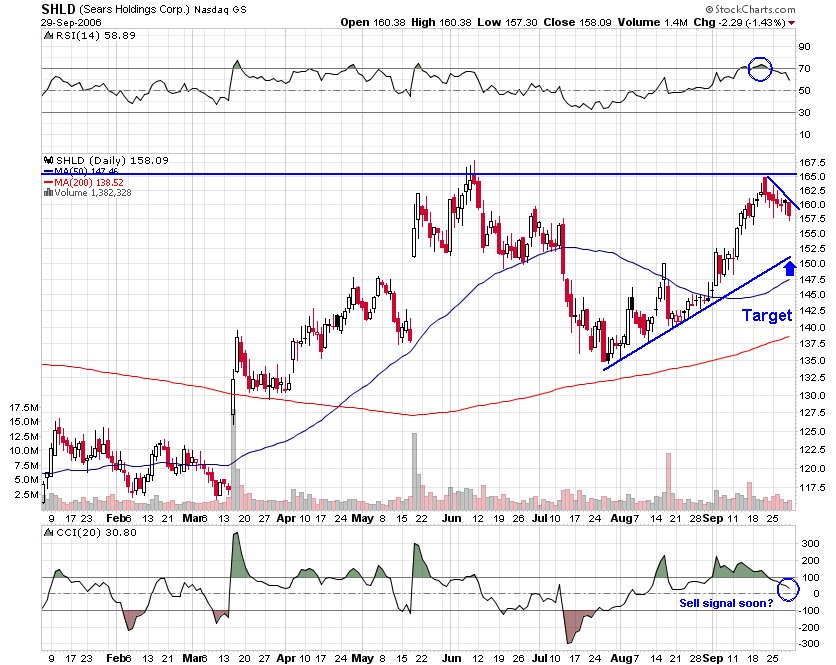
And another double top in SHLD. Ride it down to at least the upsloping trendline and set your stop around 165.
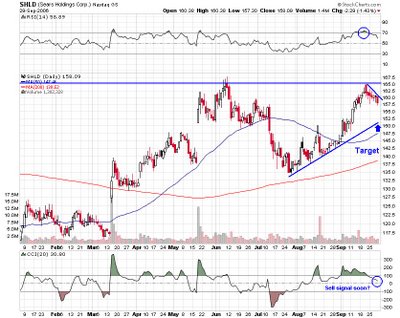
By the way, what I am calling double tops could quickly become double top breakouts. If these stocks start making new highs on above average volume be sure to cut your losses short. At these pivot points you have a low risk entry. Also, GS has not been able to move higher since last week but has not reversed either. It takes courage but I think it is going to be a great short when the wind comes out of the financial sector's sails. NVDA has confirmed the top on volume and has started moving back down. If you went short last week you are making money.
disclosure: I have CROX Oct 30 puts
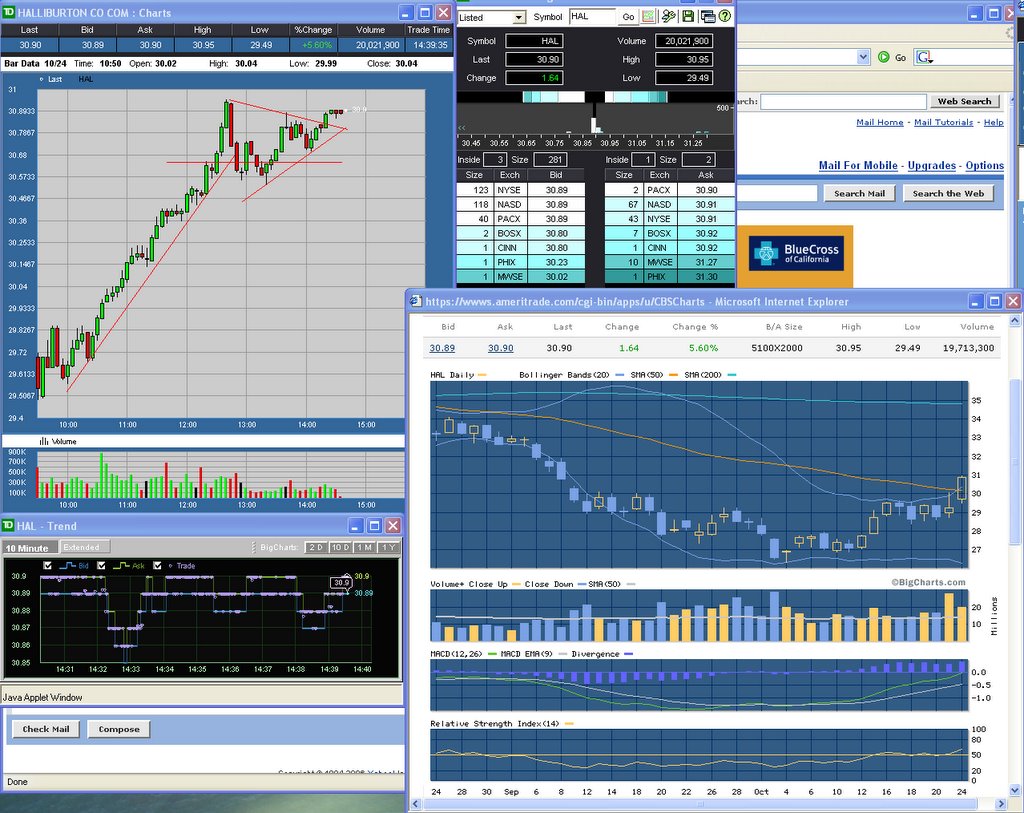
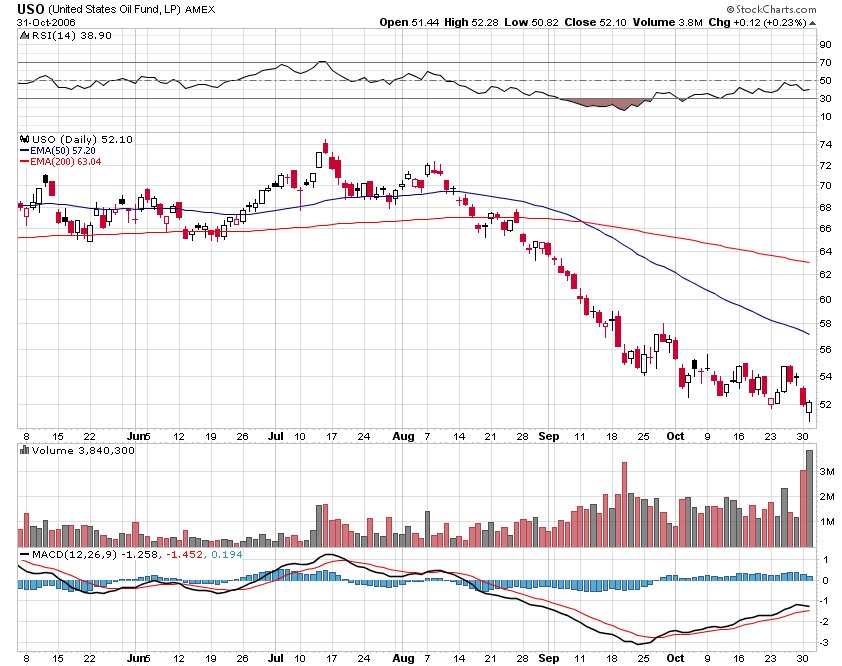 Did oil bottom today, on this last day in october? It did make a new low, but reversed and actually closed higher for the day. The chart above includes many striking features. I'll point out a few that you might find interesting. The 50 ema has never crossed below the 200 ema on any oil chart going back 3yrs until recently. Similarly, the RSI hasn't gone below 20 and the MACD hasn't seen as low as -3 on any chart I can find. These events occured in mid september right about the time USO made a new volume high above 3M shares traded and closed at the low of that day. Here we are today with a new low and a new volume high of almost 4M shares, but this time we had an up day. Both the RSI and MACD have bottomed and suggest that oil should be almost through. Today may be the capitulation needed. Take a look at HAL compared with the oil etf USO. It broke out last week as expected, then formed a bull flag and is now headed straight for that 200 dma just under 35. Note the price action relative to it's 200 ema (green line) compared with its 200 dma (red line). Also, fibonacci analysis of this move suggests a target near 35. Happy Halloween everyone!
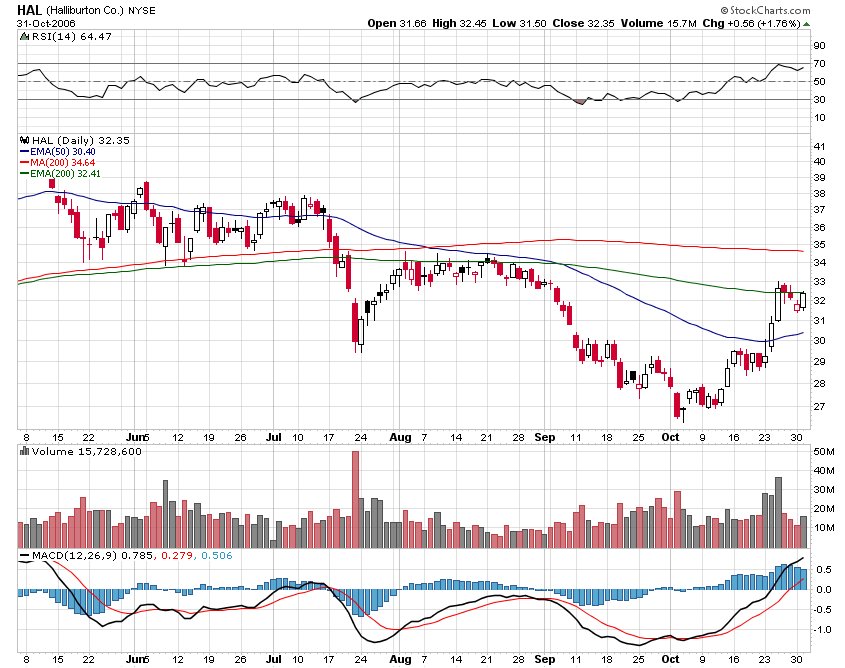 This is what HAL looked like on my screen intraday when it broke out last tuesday, it was easy money from this point on. Happy Halloween everyone!
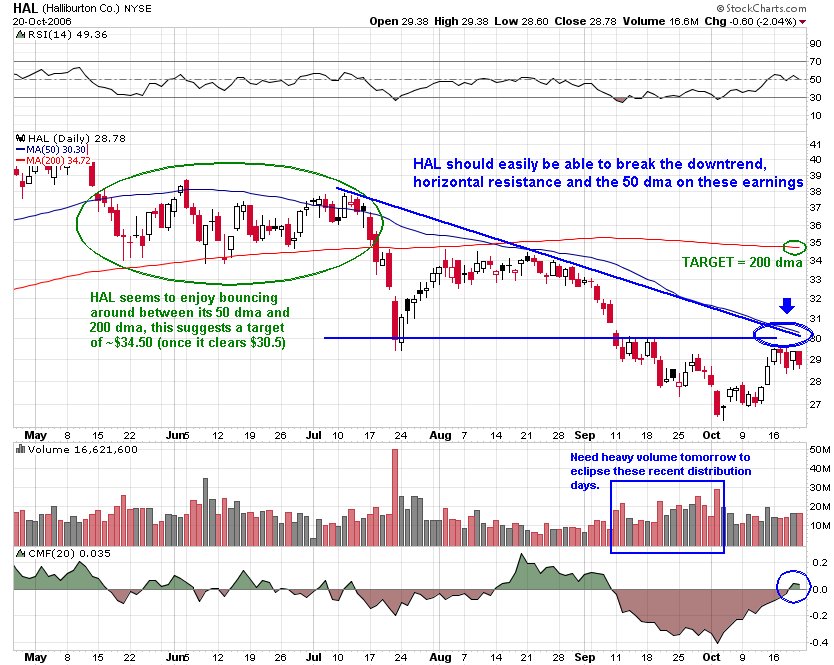


