
Saturday, February 28, 2009
Thursday, February 26, 2009
2009, The Year of the Bear (so far)

 We are just about to end the second month of 2009 tomorrow and February is shaping up to be even worse than January. The S&P 500 high of the year was made on the first Monday of this year and oddly enough, the low for the year was last Monday. That low almost touched the bear market low at 741.02 set last November, which represents an 11 yr low! So if the S&P drops just a little futher all buyers for the past 11 yrs are underwater. That kind of action can cause investors to panic sending stocks sharply lower. Furthermore, the measured rule target on a break of that level is a whopping 27.4% decline! If the S&P breaks that level, expect a big move. The 2008-2009 trend is down, so I'd expect it break down, and break down hard.
That's all technical, fundamentally I think there really nothing that can move the markets higher for a while. Yesterday, the treasury/PPT basically told us they have done all they can until the stress tests are done in two months(and provide unlimited funding until then). So we have to wait two months to find out if the banks are solvent!!? I guess we can just see which ones go begging for more money, so far AIG and C seem to begging the hardest (and they are the biggest bank and the biggest insurance companies in the US). Frankly, its hard to believe that those who have been so wrong about what to do thus far will get it this time.
And in today's news, Fannie Mae (FNM) is withdrawing $15.2B from the Treasury (ATM machine) after posting a $25B loss in the last quarter...
In other news, I'm looking forward to getting one of these new bearish sleeping bags. I think many would sleep much better at night knowing they are bearish. I got these images from here.


Disclosure: I own SPY puts
Sunday, February 22, 2009
Does Black Gold Have Any Luster In The Near Future?
CLJ9 April Light Sweet Crude Oil Daily:
 This whole year we have seen the front month contract see tons of selling pressure as demand fell and supplies rose creating an abundance. As the March contract fell victim to the same scenario, we saw a squeeze towards the end and the spread between the front and back month finally narrow to under $1.00. The chart of April above shows the contract made new lows in an effort to close the spread with the front month. Now that March is out of the way, was this a false breakdown? Or a continuation of the trend, lets take a look at more...
This whole year we have seen the front month contract see tons of selling pressure as demand fell and supplies rose creating an abundance. As the March contract fell victim to the same scenario, we saw a squeeze towards the end and the spread between the front and back month finally narrow to under $1.00. The chart of April above shows the contract made new lows in an effort to close the spread with the front month. Now that March is out of the way, was this a false breakdown? Or a continuation of the trend, lets take a look at more... April/March Crude Spread: The daily chart shows the spread between March and April crude oil narrow from a high of $8.19 on Feb 12 to $0.77 Feb 20.
Continuous Front Month Light Sweet Crude Oil Weekly:
 Long term oil has very strong support here as shown in the chart below. This support has created an inverted Head and Shoulders formation with a $50.00 neckline. We shall see if crude will be able to hold this support, break out of this downtrend, and test the neckline resistance level.
  Past performance is not indicative of future results. The risk of loss in trading futures and options is substantial and such investing is not suitable for all investors. An investor could lose more than the initial investment.
 Long term oil has very strong support here as shown in the chart below. This support has created an inverted Head and Shoulders formation with a $50.00 neckline. We shall see if crude will be able to hold this support, break out of this downtrend, and test the neckline resistance level.
 Continuous Front Month Light Sweet Crude Oil Monthly: Monthly long term support trend line from 1999. A break under this support and crude can be subject to a retest of the lows and a continuation of the trend. For now, look at it as a complete retracement from its breakout in 2004 where old resistance has now turned into support.
 Monthly long term support trend line from 1999. A break under this support and crude can be subject to a retest of the lows and a continuation of the trend. For now, look at it as a complete retracement from its breakout in 2004 where old resistance has now turned into support.
 Does Silver have something to show us of what oil can do from here? Lets take a look...
Continuous Front Month Silver Monthly:
Past performance is not indicative of future results. The risk of loss in trading futures and options is substantial and such investing is not suitable for all investors. An investor could lose more than the initial investment.Saturday, February 21, 2009

Thursday, February 19, 2009
Tuesday, February 17, 2009
The 5th Wave Has Begun, Volatility is Expanding
Volatility is expanding as the small caps (IWM) break to the downside:
 Looking at the VIX, the downtrend from the Nov. peak broke today:

Longer term, the S&P clearly seems to be continuing to the downside:
 If we use a simple measured rule, when the S&P 500 breaks 741.02 (November low) the target would be 538.19 which is 43% below the early January high. Of course at first glance this seems ridiculous, but I wouldn't count it out. The 3rd wave in this bear market involved a 48.5% decline, so the magnitude is not completely unreasonable. Also, I have seen some seemingly sound fundamental arguments for a target in the 500's. In terms of timing, for the Elliot wave model above, the up cycles both lasted two months while the down cycles lasted 5-6 months. If the 5th wave really did begin in early January, as I'm implying, then this would suggest a bottom in late Spring or early Summer. Put a gun to my head, I'd guess the S&P 500 bottoms in the 500's in June ending this bear market (the economy will take longer).
If you are looking for shorts, I still like STT and I know betweenthebars is a big fan of SPG. If you are looking for inspiration, take a look at TRMP, Donald Trump's company. Good luck and remember, you are responsible for your investment decisions.
Disclosure: I own SPY puts.
 Looking at the VIX, the downtrend from the Nov. peak broke today:
Longer term, the S&P clearly seems to be continuing to the downside:
 If we use a simple measured rule, when the S&P 500 breaks 741.02 (November low) the target would be 538.19 which is 43% below the early January high. Of course at first glance this seems ridiculous, but I wouldn't count it out. The 3rd wave in this bear market involved a 48.5% decline, so the magnitude is not completely unreasonable. Also, I have seen some seemingly sound fundamental arguments for a target in the 500's. In terms of timing, for the Elliot wave model above, the up cycles both lasted two months while the down cycles lasted 5-6 months. If the 5th wave really did begin in early January, as I'm implying, then this would suggest a bottom in late Spring or early Summer. Put a gun to my head, I'd guess the S&P 500 bottoms in the 500's in June ending this bear market (the economy will take longer).
If you are looking for shorts, I still like STT and I know betweenthebars is a big fan of SPG. If you are looking for inspiration, take a look at TRMP, Donald Trump's company. Good luck and remember, you are responsible for your investment decisions.
Disclosure: I own SPY puts.
Saturday, February 14, 2009
Thursday, February 12, 2009
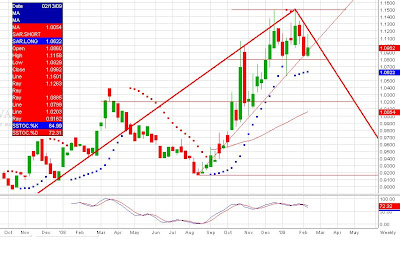
Japanese Yen ... Bearish Delight?
6JH9 MARCH JAPANESE YEN DAILY:

Head & Shoulders created January towards beginning of February. 1.10 neck broken with current bear flag setup. The resistance now comes from the highs set in mid January which created a double top of (12/17/08 1.1492 and 1/17/09 1.1496). A break above this and we could see another retest of the highs, on the other hand continued resistance and bearish setup in my opinion will bring pressure to retest the lows set in January. Stay tuned.
6JH9 MARCH JAPANESE YEN WEEKLY:

Past performance is not indicative of future results. The risk of loss in trading futures and options is substantial and such investing is not suitable for all investors. An investor could lose more than the initial investment.
Wednesday, February 11, 2009
MARCH EMINI SP500 DAILY HEAD AND SHOULDERS
ESH9 MARCH EMINI SP500 DAILY
PAST PERFORMANCE IS NOT INDICATIVE OF FUTURE RESULTS. THE RISK OF LOSS IN TRADING FUTURES AND OPTIONS IS SUBSTANTIAL AND SUCH INVESTING IS NOT SUITABLE FOR ALL INVESTORS. AN INVESTOR COULD LOSE MORE THAN THE INITIAL INVESTMENT.

PAST PERFORMANCE IS NOT INDICATIVE OF FUTURE RESULTS. THE RISK OF LOSS IN TRADING FUTURES AND OPTIONS IS SUBSTANTIAL AND SUCH INVESTING IS NOT SUITABLE FOR ALL INVESTORS. AN INVESTOR COULD LOSE MORE THAN THE INITIAL INVESTMENT.
A solution to the toxic asset problem: Give them as bonuses!
"Why not say that all bank compensation above a baseline amount - say, $150,000 in annual salary - has to be paid in toxic assets off the bank’s balance sheet? Instead of getting a check for $10,000, the employee would get $10,000 in toxic assets, at their current book value. A federal regulator can decide which assets to pay compensation in; if they were all fairly valued, then it wouldn’t matter which ones the regulator chose. That would get the assets off the bank’s balance sheet, and into the hands of the people responsible for putting them there - at the value that they insist they are worth. Of course, the average employee does not get to set the balance sheet value of the assets, and may not have been involved in creating or buying those particular assets. But think about the incentives: talented people will flow to the companies that are valuing their assets the most realistically (since inflated valuations translate directly into lower compensation), which will give companies the incentive to be realistic in their valuations. (Banks could inflate their nominal compensation amounts to compensate for their overvalued assets, but then they would have to take larger losses on their income statements.)"
It could work! I got this brilliant quote from here.
It could work! I got this brilliant quote from here.
Monday, February 09, 2009
Three Epic Calculated Risk Charts
Job losses in US recessions since WWII:

The 10 year yield since the early 60's:

Year over year % change in home prices since the 80's:

I got these from CalculatedRisk which is one of the best sources of timely economic info and charts on the web, as I'm sure most of you already know. Another reason I like CR is the no-BS headlines. You get "'Bad Bank' Plan is Dropped" instead of a vague and misleading "Bad Bank 2.0" on CNBC.

Sunday, February 08, 2009
Coiled Commodities (DBC)

Commodities as a whole are poised to make a large move soon as the recent range has narrowed substantially. The daily Bollinger Bands, a series of higher lows since December and 50 dma all seem to be converging on $20. It seems to me that a large retracement of the 2008 decline may be in order after support has shown up in the low $19s. Commodities could also break lower but I'd be more scared of a false breakdown than missing the decline. It just seems to me that now would be an appororiate time for the dollar to weaken against tangible assets (commodities) with all the money being printed in Washington. We shall see...
Saturday, February 07, 2009
Friday, February 06, 2009
I'm shorting STT here
 The gap is almost filled and State Streat has reached previously strong support on the retracement. Volume has declined and most daily indicators are back to neutral. A good stop on this seems like the falling 50 dma, currently $34.37 which might also act like resistance.
Tuesday, February 03, 2009
Silver.. 3rd Time's the Charm...
SIH9 March Silver Daily:
 Three times was the charm in silver as it broke though resistance of $10.50 December 15-16 . Prices rallied a dollar to $11.50 before the market came in and tested old resistance of $10.50 and found new support. After reaching $11.50 then cautiously testing $10.50 twice, silver has been able to push higher and break through $11.50. Reaching our first objective of $12.50 on January 30, 2009, we have seen a nice rally and have met new resistance. Profit taking at $12.50 is expected. For now silver may need a breather and try to find new support, breaking above $12.50 could attract aggressive new buyers with next upside target of $14.00.
SIH9 March Silver Weekly:


RISK DISCLOSURE: PAST PERFORMANCE IS NOT INDICATIVE OF FUTURE RESULTS. THE RISK OF LOSS IN TRADING FUTURES AND OPTIONS IS SUBSTANTIAL AND SUCH INVESTING IS NOT SUITABLE FOR ALL INVESTORS. AN INVESTOR COULD LOSE MORE THAN THE INITIAL INVESTMENT.
Sunday, February 01, 2009

Subscribe to:
Posts (Atom)
