Thursday, June 22, 2006

Has GME's time come and gone?

GME's stock has been a favorite of wall street for a few years now after they aquired their main competitor electronic games boutique (EB). It has had a decent run and hit a high at 50 recently. Take a look at this two year weekly chart, notice a previous price channel:
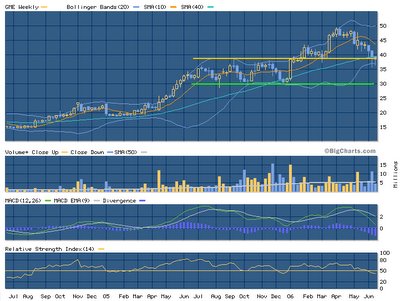
GME is the dominant player in the brick and morter video game retail industry and sells through gamestop and EB locations. The video game industry has been growing steadily over the years with the success of the playstation 2 and xbox and is likely to grow further with new systems comming out this christmas. Many have wondered not if, but when video games will begin being sold and downloaded online. When this transition occurs the brick and morters who are not ready will be hit hard no unlike the bankrupt musicland and distrubuters like Navarre. Nintendo recently announced their new wii system will be able to download games from any previous system online directly from them for 5-10$ a pop. This is bad news for gamestop because not only will it hurt sales of new games, but the re-sell portion of their business should also hurt. Many will say that nintendo is a smaller player, but they are quickly taking market share away from the competitors and the new portable nintendo DS is becoming a pop icon like the ipod. This is purely speculation but I suspect the era of game downloading to home systems will begin as early as next year. This is certainly a gradual change and not abrupt, but from a trading standpoint the top where funds and the stret begin to dump is lucrative. Also this could potentially be a very long term short given the horizons. Take a look at this 6 month daily chart:

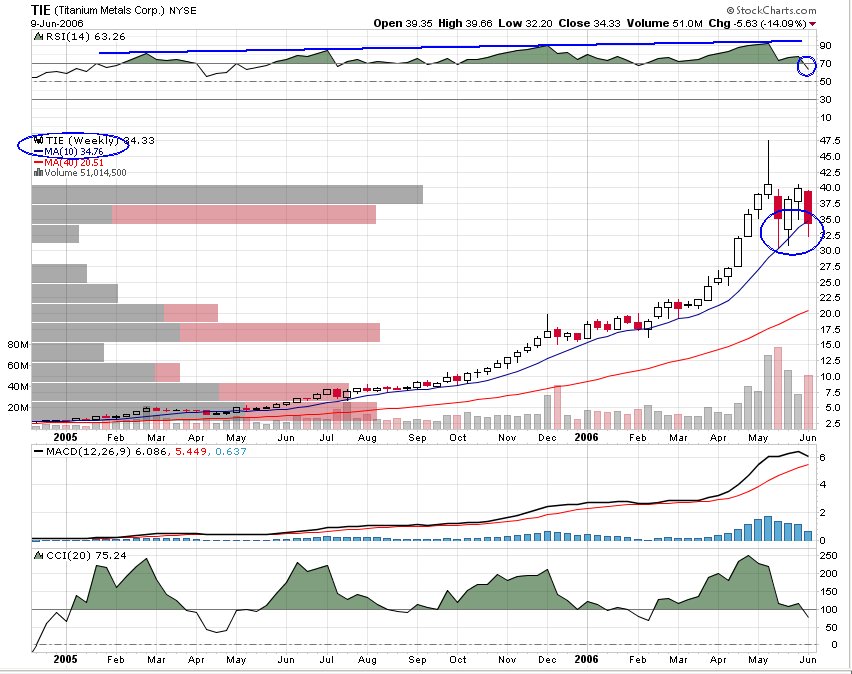
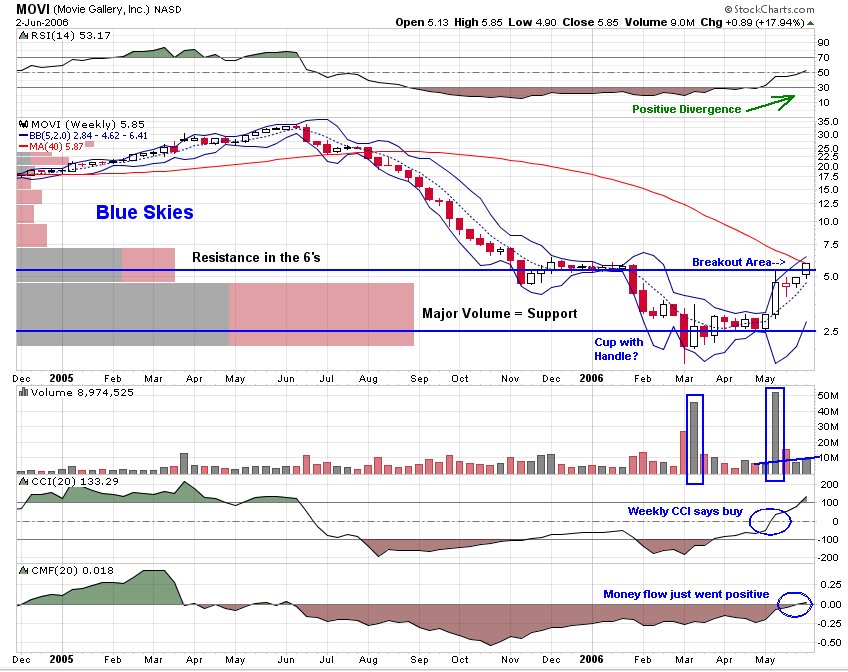
From a technical standpoint the stock has been taking on water ever since it touched its 50 on a few gap an runs. This follows the 6 months of channeling leading to the breakout. Since the decline began GME has followed a trendline down with the lower BB through support around 38 and through both moving averages (50 and 200 dma). This has occured on increasing volume and I suspect that institutions are begining to take profits on GME. The ideal entry would be at 38 or higher with an initial target around 33 where a gap becomes closed from there GME may trade in the old range for an indefinate period of time before the big collapse. I suspect when all is said and done this decline will look alot like MOVI's.

There are alot of factors to keep in mind. The new nintendo DS lite is selling out like crazy right now along with the games. But I suspect this may hurt GME because the system only sells for 130$ so if it is being bought instead of the PSP at 250$ or xbox live at 500$ then GME may miss out on some profit. GME apears to be aware of this and is trying to make up for the cheaper system by selling in house accessories and system bundles. Also nintendo's new system wii coming out this christmas will be much cheaper than the competition. Again this is just speculation but I think nintendo is going to come out way ahead in all this stealing market share from it's competitors with innovative ideas like touch screens and motion interactive games, not to mention much lower costs.

I will follow this one for a while as I suspect there may be alot of downside comming for GME. There will be more later as the situation develops. For now go try out the new nintendo DS and ask yourself if nintendo is once again about to rule the world.

More here.

NOTE: I will be on vacation for the next two weeks so there won't be much if any posting during this time. The other members may post if they want. I will be back online in the swing of things mid july. My current holdings are long: IOTN, MOVI, HOM, short: GME. Have a great summer!

Sunday, June 11, 2006

Is this TIE gonna get shot down?

Shorting this stock might make you feel like Han Solo with a ticker like TIE. The titanium producer primarily sells to companies like Boeing who use the strong and lightweight metal for aerospace. If Boeing was building tie fighters they would certainly use titanium for the frame.
The stock has pulled back considerably from it's highs about a month ago when the stock split, but its still holding above it's 50 dma after a few bounces and a pierce last thursday. Compared with any other mining stock this is a considerable feat. Last week I had been buying puts looking for a big drop when it broke it's 50 dma for the first time. It broke it's 50 dma on thursday only to reverse intraday on high volume and close alomst breakeven. This was the stock's chance to reverse and head higher, however Friday much of this effort was negated when TIE closed almost at its daily low down 5%. It has now formed a slightly widening down channel on the daily and I think its ready to re-test the 30$ low monday or tuesday. The support there won't be as strong this time because last time it was there the 50 dma was just above 30. Also note there is alot of room to fall once the 50 dma is breached and 30 is broken (forming an ABC continuation pattern). Furthermore, on the weekly chart TIE actually did close just below it's 10 week average (~50 dma) for the first time since this parabolic move began over one year ago.
I think the fundamentals are on your side too because metal prices are declining after a couple year parabolic, speculation induced move (especially in Ti). Furthermore, Russia is producing more and more Titanium and recently signed a major 18B$ deal with Boeing to sell them Titanium. I'm not sure how much market this will take away from TIE, but it can't be good for them. In addition, TIE trades at more than twice it's peers valuations.

TIE's PE: 38
ATI's PE: 14

I also thought the recent activity of these Japanese Titanium companies was interesting, but I'm not sure how good of an indicator this actually is. They have been getting hit hard as of late and now lie well below their 50 and 200 dma's.

I'm sure you can find more reasons why TIE should fall, like BA's poor performance recently.
My only concern is that we have options expiration this friday and TIE has one of the highest implied volatilities out there. It is certainly a very good canidate for a max pain pin because of the large interest in selling TIE options. Max pain currently lies at about 30 but as I learned last month it can change rapidly as the option volumes spike towards the end of the week. By the look of the chart I would guess there will be more of a tendency towards 32.50 or 35 due to options but clearly this stock wants to go down and it may be impractical for the option writers to try and hold it up here.

The Market Observations blogger has nailed the TIE short in the past. He literally called the top and got me looking at TIE to begin with about a month ago. After some consolidation he is bearish on TIE once again.

This article on titanium process technology might be worth a look. Aparently a new company out of MIT has a way to cut the costs of titanium processing from about 40$ to 3$ per pound.

Wednesday, June 07, 2006

DAKT Top?

For aggressive traders DAKT appears to be ready for at least a short term decline. Today it formed a long tail on very high volume that matches with previous tails. I think this should be good for a short term drop down to at least 48, maybe 47.Depending on how it behaves it's self there could potentially be a very large decline as it DAKT could be forming a long term top with such heavy volume in this 52-week high territory. Its certainly worth keeping an eye on. I have no position currently but will prob try and short it for a one-two day trade. Note, this stock is the strongest stock (not too many bearish indicators) I have mentioned as a possible short since this sites inception and it is the most risky. However, I have found the first few drops in a reversal to be the most profitable if they can be timed correctly and I smell a reversal comming in DAKT.

As an update to previous posts, I am now out of DRIV but I think it will fall further. See the HOM comments for how my position progressed there. I have added MOVI Sept 7.50 calls and I now have a fairly decent position in TIE puts, see my market vibration post for more info.

Sunday, June 04, 2006

A Perfectly Bearish Top in HOM

Take a look at this HOM chart and put yourself in the shoes of any holder. Fundamentals aside can you find any reason to buy/hold this stock. Some found one thursday when it bounced off it's 50 dma "like a rubber ball." But those buyers were punished friday with bearish engulfing on the highest volume ever. This comes after a perfect shooting star top formed just over a week ago to end the parabolic rise in HOM's price. Other indicators are pointing down, like the negative divergence in the RSI, CCI that just crossed zero and a double top in the MACD.
Caution is waranted, HOM is a hurricane play. Aside from ZENX (imo), HOM was (and may be in the future) the strongest hurricane play. Last year they reaped huge profits on rebuilding the South in the wake of Rita and Katrina. Another disasterous hurricane and HOM could pop. But it seems to me the stock has already made its move in anticipation of a strong hurricane season nearly tripling in price in six months. The stock's weakness friday is strongly correlated with a very negative report by the folks at Stock Lemon. Find it here. If any reader can find a more bearish chart I'd like to see it.

Disclosure: I bought June 10$ puts at the close Friday.

Saturday, June 03, 2006

MOVI is on the move

Ok, hoky title for my first article but it is true. After a 2005 that left bagholders reeling, MOVI turned in first quarter 2006 earnings that reversed the long slide. That long slide started in the 30's, only to finish in the single digits.


Driving this slide were concerns over the companys ability to pay down the debt load it took on in order to finance the takeover of a competitor, the Hollywood chain of video rental outlets. In fact, by early this year there were serious fears in the market of bankruptcy, while the company continued to under-perform financially.

In the mean time management has gotten religious about cost controls and the stock price situation turned around with the release of first quarter 2006 earnings on May 11. Let's take a closer look.


Basher types trained in technical analysis (fortunately, there aren't many of them) will see a glaring gap in the daily chart that will most certainly be filled and we must be prepared for that. In comparing the weekly and daily I see a penant that touched the upper BB on Friday, on both charts strangely enough. Resistance could be provided by the 200dma that is just entering the picture on the daily chart, at $6.48. Confirmation to that resistance level is shown by the Price by Volume overlay in the weekly chart. There is a second large group of bagholders at this level who must be satisfied before we go forward. However, I believe we are looking at blue-sky time after that.

How long will this take? Well, I don't know. But I believe we'll see a resolution to this whole situation with the second quarter earnings which should be presented sometime in August.

In terms of fundamentals and projections, I took the time to put together a spreadsheet.

(click to enlarge)