 I would now say that oil is definately in a confirmed uptrend until USO breaks below it's 50dma, this means buy energy stocks. My favorite charts in the sector are MEE, BTU, MRO, XTO, CVX and the etf's XLE and OIH. But to be honest every energy stock i look at has an awesome chart.
Last week the exchanges saw some major selling after a huge run-up of the entire sector. The worst hit were NDAQ, NYX, NMX and ICE. The New York Stock Exchange (NYX) for example, made a parabolic run through 100$ on speculation that the merger with european exchange Euronext would be approved. Par (100) had made a good target but it was met with major selling and now there are a ton of new NYX holders in the red. In the very least the stock needs to pullback to a support zone near it's 50dma around 85$. I don't expect the previous high just over 90 to hold, but it may provide an intermediate bounce.
 The weekly ICE chart below looks like it may have formed it's second major top since the IPO. Many aspects of the chart look similar to the last peak. I would target the 50 dma first then a rising trendline currently around $75.
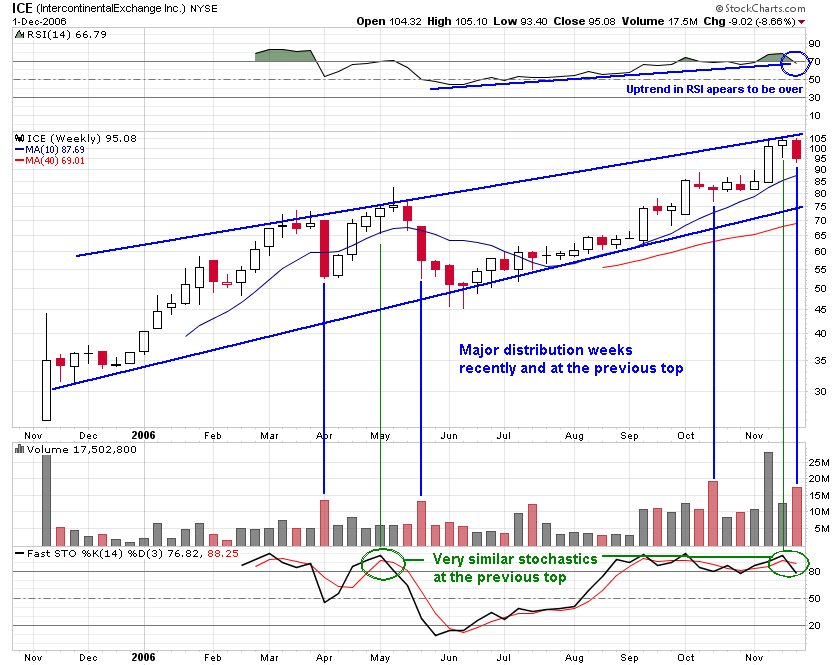 With the exchanges leading this market higher for weeks as oil went lower the broad indicies had a major run higher. With the leadership being taken out and oil reversing the dow, s&p and nasdaq all saw a major week of distribution. I don't want to speculate too much here other than to say watch for more signs of weakness as this market may be forming a top or at least correcting.
 Disclosure: I own NYX puts.
No comments:
Post a Comment