
Disclosure: I am long SPXL, seems to be headed higher.


 It feels like most market participants are expecting a massive rally after Greece gets bailed out again and are afraid to sell. I don't claim to know how the market will react to the inevitable bailout news, but stocks are well positioned for a fall from here. I'm thinking that any push higher (perhaps on bailout news) from here provides a low risk shorting opportunity, at least in the intermediate term. So far I just have a few small shorts on but hope to add more this week.
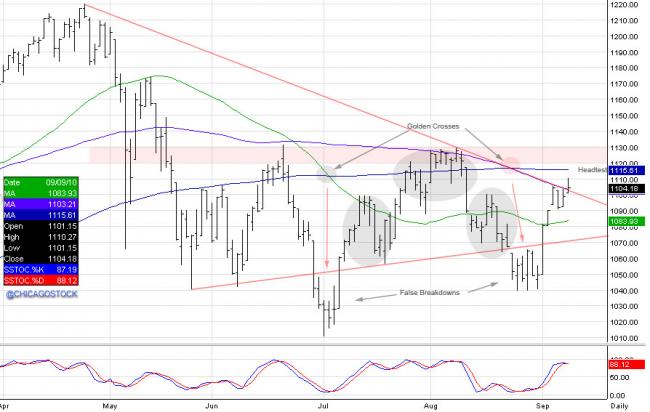
The SP500 is stuck between a rock and a hard place after the highs for the year were made in April up to the 1220 level. For the past three months, the market has been trading within a range of 1000-1130, as forces continue to push and pull this market back and forth. The SP index is up 7.1% for the quarter, up 10.8% from the lows in July, down 9.5% from the highs in April, and still finds itself to be at -.01% for the year! There has been a lot of fundamental activity that has attributed to the indecision in investors and the market to find direction, however this market has also rallied 83% from the lows in March of 09 before the brakes were hit in April as the SP retraced nearly 61.8% of its fall from 2007-2009. This year has been a year of consolidation to put it at best.
The high created a small head and shoulders in April which ultimately led to the flash crash. The past 4 months has been a right shoulder of a much larger h/s formation as seen in the weekly and monthly charts below. The daily chart above has brought 2 "golden crosses". A golden cross is when a short term moving average breaks through a longer term moving average. The first cross was created in early July as the SP500 sold down to then 1010 level, the 50 day crossed through the 200day moving average. This breakdown failed and the market marched back up to 1130 and created another head and shoulders formation between 1060-1130. The second golden cross was created in late August as the market broke the neckline of 1060 and the 100 day moving average crossed through the 200day to sell down to the 1040 level. This breakdown once again failed and the market held to create a right shoulder in an inverted h/s pattern from May to August. This test late August saw 3 lows (1039.83, 1039.70, 1040.88) another inverted h/s pattern. This area subsequently was also the time that the Fed chairmen Ben Bernanke reiterated he did not expect to see another double dip in the economy. Another squeeze occurred and the market traded back to the 1100 level. As of this Thursday the SP500 has broken through the trend line from the April highs to the August highs. This is a major area of resistance, as the market is now testing the "head" of the h/s pattern up to the 1130 area. The reason there are so many h/s patterns in my opinion is due to the market consolidating and fighting between forces back and forth.
The bulls at these levels need to try and hold to regroup and attempt to squeeze higher once again. They can say the ball is in their court because the market is in an uptrend for the past 2 years, and the longer they hold these levels the better shot they have at pushing higher. Working with an inverted h/s formation between 1130 and 1060, which could potentially target them to the 1256 area. To do this, they will have to break through 1130, hold to test 1150, 1175, and ultimately the larger head and highs in April. Sellers will be met at all of these levels with first line of defense at 1130. Below the weekly chart will attempt to show a different view and possible scenarios.
 Weekly shows a 38.2% retracement of the rally from March of 2009 to April of 2010. Since the highs the market has consolidated and stayed well under 1130. This has created an inverted h/s formation between May and August of (1129.50 head, 1002.75 neckline) that would lead to 1256. This formation is within a right shoulder of a much larger head and shoulders pattern that forms from September of last year to now with the highs in April and 1000 level as the neckline. This range and break of 1000 targets the 783 area. If you have faith in Ben Bernanke, you would not be in this camp looking for that direction. However it is the larger formation which is stronger and leaves the market needing more energy to push higher and get through resistance.
Above, the monthly chart shows the head and shoulders formation that is embedded between the neckline of 1000 and the highs in April of 1219.80. So for the past 4 months, we have been digesting market activity within this right shoulder. Head being near the 61.8% retracement, and neckline being at the 38.2% retracement. If you are a bear, this would be the right level to sell into and risk the highs, bulls have the "plunge protection team", quantitative easing, and nothing but buy stops above. Continue to monitor these technical levels, with the break of support we want to be sellers, and with the break of resistance we want to be buyers. Play the range until the market finds conviction to move one direction or the other.
 Volatility and "fear" factor continues to die out and the vix has traded within 21 and 28 for the past two months. This is a range where one would want to consider buying protection against long positions when vix nears lower end.
Quick video on price action from April highs to today:
RISK DISCLOSURE: PAST PERFORMANCE IS NOT INDICATIVE OF FUTURE RESULTS. THE RISK OF LOSS IN TRADING FUTURES AND OPTIONS IS SUBSTANTIAL AND SUCH INVESTING IS NOT SUITABLE FOR ALL INVESTORS. AN INVESTOR COULD LOSE MORE THAN THE INITIAL INVESTMENT. OPINIONS EXPRESSED. INFORMATION COMPILED FROM SOURCES BELIEVED TO BE RELIABLE, ACCURACY CANNOT BE GUARANTEED.
Thank you and best of luck trading!
Stewart Solaka
futuresMONSTER
Twitter -Chicagostock
 XLF (Financial sector ETF), 6 month, daily:


