Friday, September 10, 2010

09/10/10 SP500 Market Update - Battle of the Golden Crosses


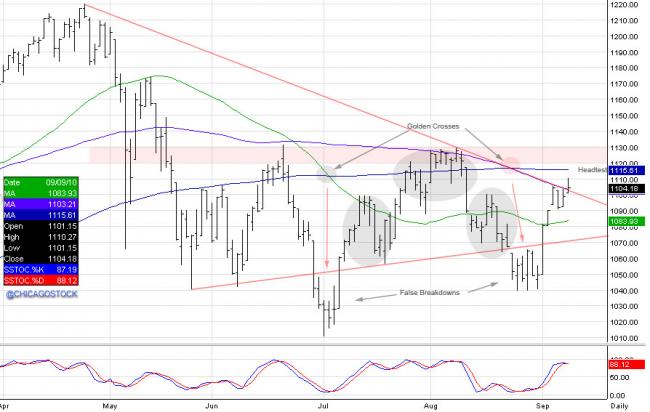
$SPX Cash SP500 Index Daily 04/01/10-09/09/10:

The SP500 is stuck between a rock and a hard place after the highs for the year were made in April up to the 1220 level. For the past three months, the market has been trading within a range of 1000-1130, as forces continue to push and pull this market back and forth. The SP index is up 7.1% for the quarter, up 10.8% from the lows in July, down 9.5% from the highs in April, and still finds itself to be at -.01% for the year! There has been a lot of fundamental activity that has attributed to the indecision in investors and the market to find direction, however this market has also rallied 83% from the lows in March of 09 before the brakes were hit in April as the SP retraced nearly 61.8% of its fall from 2007-2009. This year has been a year of consolidation to put it at best.

The high created a small head and shoulders in April which ultimately led to the flash crash. The past 4 months has been a right shoulder of a much larger h/s formation as seen in the weekly and monthly charts below. The daily chart above has brought 2 "golden crosses". A golden cross is when a short term moving average breaks through a longer term moving average. The first cross was created in early July as the SP500 sold down to then 1010 level, the 50 day crossed through the 200day moving average. This breakdown failed and the market marched back up to 1130 and created another head and shoulders formation between 1060-1130. The second golden cross was created in late August as the market broke the neckline of 1060 and the 100 day moving average crossed through the 200day to sell down to the 1040 level. This breakdown once again failed and the market held to create a right shoulder in an inverted h/s pattern from May to August. This test late August saw 3 lows (1039.83, 1039.70, 1040.88) another inverted h/s pattern. This area subsequently was also the time that the Fed chairmen Ben Bernanke reiterated he did not expect to see another double dip in the economy. Another squeeze occurred and the market traded back to the 1100 level. As of this Thursday the SP500 has broken through the trend line from the April highs to the August highs. This is a major area of resistance, as the market is now testing the "head" of the h/s pattern up to the 1130 area. The reason there are so many h/s patterns in my opinion is due to the market consolidating and fighting between forces back and forth.

The bulls at these levels need to try and hold to regroup and attempt to squeeze higher once again. They can say the ball is in their court because the market is in an uptrend for the past 2 years, and the longer they hold these levels the better shot they have at pushing higher. Working with an inverted h/s formation between 1130 and 1060, which could potentially target them to the 1256 area. To do this, they will have to break through 1130, hold to test 1150, 1175, and ultimately the larger head and highs in April. Sellers will be met at all of these levels with first line of defense at 1130. Below the weekly chart will attempt to show a different view and possible scenarios.


Continuous Emini SP500 Weekly 01/16/09-09/09/10:
Weekly shows a 38.2% retracement of the rally from March of 2009 to April of 2010. Since the highs the market has consolidated and stayed well under 1130. This has created an inverted h/s formation between May and August of (1129.50 head, 1002.75 neckline) that would lead to 1256. This formation is within a right shoulder of a much larger head and shoulders pattern that forms from September of last year to now with the highs in April and 1000 level as the neckline. This range and break of 1000 targets the 783 area. If you have faith in Ben Bernanke, you would not be in this camp looking for that direction. However it is the larger formation which is stronger and leaves the market needing more energy to push higher and get through resistance.

$SPX Cash SP500 Index Monthly 02/01/07-09/09/10:

Above, the monthly chart shows the head and shoulders formation that is embedded between the neckline of 1000 and the highs in April of 1219.80. So for the past 4 months, we have been digesting market activity within this right shoulder. Head being near the 61.8% retracement, and neckline being at the 38.2% retracement. If you are a bear, this would be the right level to sell into and risk the highs, bulls have the "plunge protection team", quantitative easing, and nothing but buy stops above. Continue to monitor these technical levels, with the break of support we want to be sellers, and with the break of resistance we want to be buyers. Play the range until the market finds conviction to move one direction or the other.


$VIX Cash Volatility Index Daily 03/01/10-09/09/10:
Volatility and "fear" factor continues to die out and the vix has traded within 21 and 28 for the past two months. This is a range where one would want to consider buying protection against long positions when vix nears lower end.

Continuous Emini SP500 / Continuous 30 year Treasury Bonds Weekly:


Quick video on price action from April highs to today:


RISK DISCLOSURE: PAST PERFORMANCE IS NOT INDICATIVE OF FUTURE RESULTS. THE RISK OF LOSS IN TRADING FUTURES AND OPTIONS IS SUBSTANTIAL AND SUCH INVESTING IS NOT SUITABLE FOR ALL INVESTORS. AN INVESTOR COULD LOSE MORE THAN THE INITIAL INVESTMENT. OPINIONS EXPRESSED. INFORMATION COMPILED FROM SOURCES BELIEVED TO BE RELIABLE, ACCURACY CANNOT BE GUARANTEED.

Thank you and best of luck trading!


Stewart Solaka
futuresMONSTER

Twitter -Chicagostock


Saturday, September 04, 2010

Saturday Rock Blog: Fuck You


I'm becoming increasingly bullish on the market, I no longer have any index puts and I have opened long positions in AUD and EUR. This chart doesn't look super bullish but clearly 1040 (neckline) is holding and there is even a false breakdown to boot. Other indicators (MAs, stochs, CCI) are also starting to turn up as the increasingly low volume of summer wanes. It seems like the market likes the economic news that came out last week so that could be the catalyst for the next leg higher. The head and shoulders pattern that we had all been watching just didn't pan out. Anyways, one thing is for sure, the S&P has been stuck in a very annoying range for a while now:

Saturday, August 28, 2010

Saturday Rock Blog: Bob Rules


I really thought the Aussie Dollar ($AUDUSD) would have broken down harder after it lost it's 50 and 200 dmas and the dma cross over happened. Instead AUD reversed the breakdown after forming a double bottom. The daily chart is actually looking pretty bullish to me now, the top of the range should be test, in the least. The weekly chart below shows that AUD still has not taken out it's 2007 highs but the range bound behavior over the past year or so now looks like consolidation before the next move higher. Perhaps the next move will take AUD to new all time highs against the dollar. I don't have any position in this at the moment.


Saturday, August 21, 2010

Saturday, August 14, 2010

Monday, August 09, 2010

Saturday, July 31, 2010

Saturday, July 24, 2010

Saturday, July 17, 2010

Saturday Rock Blog: Shine (on the Sun Bear)


Everything about this chart says that a new trend has begun. The six month S&P charts has increasing volume on down days, decreasing volume on up days. A cross of death and a series of lower highs. The stochastics and CCI are both about to give renewed sell signals (market worked off oversold conditions). We held the flash crash low barely on Friday but I suspect op ex had something to do with that. Watch for a close below 1040 to confirm what everybody is wondering: Has a new bear mearket begun? If so, I'd guess it doesn't take as long as my patience to get to that head and shoulders target at 860. Enjoy the beautiful weekend everyone!

The Malaysian Sun Bear:


Disclosure: I own SPY puts, plan to hold them for a while.

Saturday, July 10, 2010

Saturday Rock Blog: Stars


Turns out I'll be seeing these guys perform down the street later today. These guys were kinda big in the 90's and came from where I currently live. It should be fun, have a great weekend all.

Friday, July 09, 2010

S&P 500 Rallies as Cross of Death Completes


After completing a nearly perfect H&S top on the S&P 500 daily and hitting new lows for 2010, the bulls have come out to squeeze the bears. What a surprise! Nope, seen it a million times. Just when the bears get a grip on things the market miraculous rallies to squeeze the bears. I think stock have likely begun a new bear market as evidenced by a number of technical indications. The series of lower highs and lower lows on both the daily and weekly time frames is an obvious one. Then there's the cross of death on the dow and the S&P, note that this has not yet occurred on IWM or QQQQ yet (but it will soon). Further, you can see that the 50 dma and 200 dma on the S&P 500 are now both declining. I could go on and on about how strong the economic argument is for a renewed weakness in stocks, but.. eh, I'll leave that for another day. There were some short term buy signals this week and after the bulls retook 1040 its no surprise that there has been a squeeze on the false breakdown. Once the market falls back below 1040 I think I will be ready to declare a new bear market with certainty and bet the house short. For now I am happily long as I wait to see how far the retards on Wall Street continue this low volume squeeze. I hope you are all enjoying your summer?

Disclosure: I am long IWM August calls.

Saturday, July 03, 2010

Wednesday, June 30, 2010

Monday, June 28, 2010

Forex Market Pitfalls (Guest Post)

From Bryan Sayers, a ForexFraud.com exclusive:


How Forex Market Manipulation can Affect You

A number of formerly innocent forex traders have become increasingly aware of the possibility of forex market manipulation, despite the market’s huge size. The manipulation game tends to be played by large and active forex market participants like market making financial institutions and hedge funds.In fact, one of the pitfalls of technical trading is that large market players familiar with your methods can often reasonably anticipate where your stop loss and take profit orders are going to be placed in the market. The low liquidity seen in thin markets also provides ample opportunity for forex market manipulation.The following sections discuss some of the types of forex market manipulation and the situations in which they tend to occur.


Thin Markets

Thin markets provide fertile ground for forex market manipulation since large traders can put less pressure on the market to make a bigger impact on the price. For example, the trading time just after the Sydney open at 5pm EST when other more liquid forex markets like London and Tokyo are closed and New York is closing down for the night can be especially thin.Bank holidays and economic data releases also thin down trading in the forex market since many players are either on vacation or standing aside while the news comes out.


Stop Hunting

Forex traders using technical analysis to base their trades on tend to look for certain conditions or price action occurring in the market. For example, this might be a classic chart pattern like a head and shoulders bottom or a double top. Since everyone is pretty much looking at the same price data, this means that large players can reasonably anticipate where stop orders may be placed in the market, even if they are not themselves watching those orders.This situation can arise even when using technical analysis packages that have the best forex software reviews. Unfortunately, the phenomenon provides fertile ground for forex market manipulation, especially by large players trading in thin markets.For example consider the situation of a market in AUD/USD in which the price action has been forming a triangular consolidation pattern over the last week trading between converging trend lines. Many technical traders knowledgeable about how to use chart patterns when trading will be able to observe this formation themselves on their own charts.They will then probably look to buy low and sell high within the consolidation pattern with stop and reverse orders placed outside the converging trend lines which define the pattern to profit from the triangle breakout’s measured move. As more and more traders observe this pattern and establish positions, orders begin to accumulate in certain price level regions.Market makers know this very well, and a large player can simply identify a place where the market is not too far away from key stop loss levels placed just outside the converging trend lines. They then transact large amounts in order to pressure the market into triggering these accumulated stop loss orders.Furthermore, once the stops have been triggered, the large player merely has to quietly cover their position in order to show significant profits from their intentional manipulation of the forex market.Of course, a more insidious type of stop hunting can occur when a forex market maker is holding a large amount of stop-loss orders within a certain narrow price region. If the market approaches this region, they simply have to coax it a little further in order to trigger all of the stop orders they are holding and therefore profit from any trades they may have executed in advance of those order levels. Many retail forex traders do not understand that these forms of market manipulation are standard operating procedure for professional currency traders working at large financial institutions. Sometimes, they accuse their forex broker of hunting for stops when they are only quoting the market prices which have been manipulated by the larger players who have the ability to control the forex market in some circumstances simply by virtue of their impressive size.


Front Running Orders

Like with stop hunting, front running involves the intentional manipulation of the forex market in order to profit from held or anticipated orders that have been placed in the market. For example, consider the case of a forex market maker in AUDUSD holding a large buy order for Australian Dollars at 0.8500. As the market approaches the order level, the market maker will often front run the order by purchasing AUDUSD at levels just ahead of the order price which tends to keep the market from reaching the order level. Nevertheless, if the market does continue on to trade at the order level, the market maker simply takes a small loss and fills the client with what they purchased slightly higher.Also, if the market does not trade at the order level in sufficient size to allow the market maker to fill the order in its entirety, then they often simply sell the AUDUSD they did manage to purchase out at a profit when the market recovers due to the buying pressure. The disadvantage of front running from a client’s perspective is that the market maker trading ahead of the order may result in the order never being filled. Of course, the market maker still profits from having been allowed to work the order for their customer.


Order Slippage

The primary situation in which order slippage occurs is with the execution of stop-loss orders. Most stop-loss orders will be entered into the market in such a way that if a certain level trades, then this triggers the order which will then be executed at the best available market price as quickly as possible.What this means is that the stop order may not actually be executed at the level at which the stop loss was triggered. The difference between the stop loss trigger level and the executed price for the stop loss order is commonly known as order slippage. As if being stopped out were not bad enough, unscrupulous market makers and dealing desk staff also routinely exploit what they see as the opportunity to make money from their clients who entrust them with stop loss orders. They do this by increasing the order slippage on the rate of their stop-loss order and showing the client an even worse execution rate. By doing so, they make a few extra pips off of their clients.Order slippage rarely occurs on take profit orders, although it has been reported to have occurred with some questionable online retail forex brokers. What is more common, however, is that the take profit order is simply not filled if the market reverses sharply from that level and any amount executed on behalf of the client is simply closed out by the market maker at a profit for them, but not the client of course.

Sunday, June 27, 2010

The head & shoulders everyone is talking about

Here's the 9 month daily S&P 500 chart:

The head and shoulders pattern that seems to be forming here has a neckline at 1040 which is 180 points below the top of the head at 1220. Using a simple measure rule (1040-180) I get a target of 840 upon a close below the neckline. Currently I don't have a position in the S&P directly but I do have a few IWM puts.

Sunday Rock Blog: (Sitting' on) the Dock of the Bay


Disclosure: As tempting as it is to try and play BP capitation by going long, I can't try catching this falling knife here. No position.

Wednesday, June 23, 2010

Tuesday, June 22, 2010

Saturday, June 19, 2010

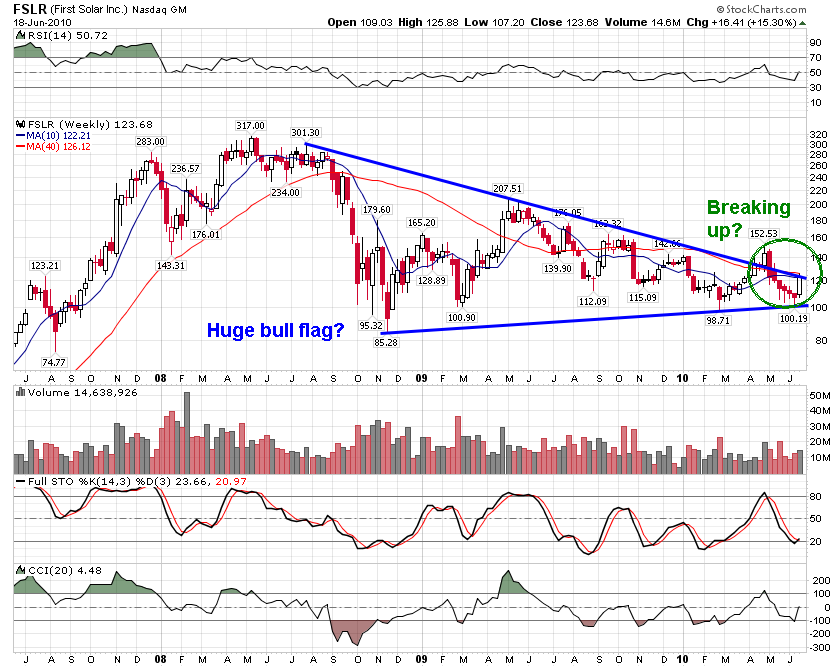
Saturday Rock Blog: Israelites (Solars Bottomed?)

Sun Power (SPWRA) six month, daily:
First Solar (FSLR) three year, weekly:

Thursday, June 17, 2010

Freddie Mac Notifies NYSE of Intention to Delist


MCLEAN, Va., June 16 /PRNewswire-FirstCall/ -- Freddie Mac (NYSE: FRE) today announced that the company has notified the New York Stock Exchange (NYSE) of its intent to delist its common stock and the 20 listed classes of its preferred stock. This notice was made pursuant to a directive by the Federal Housing Finance Agency (FHFA), Freddie Mac's conservator, requiring Freddie Mac to delist its common and preferred securities from the NYSE. According to a press release by FHFA, the Acting Director of FHFA issued similar directives to both Freddie Mac and Fannie Mae.

http://online.wsj.com/article/PR-CO-20100616-903411.html?mod=wsjcrmain

Freddie Mac Starts Mortgage Relief For Gulf Coast Homeowners

Freddie Mac (FRE) said Thursday it was invoking a mortgage-relief policy for borrowers hurt by the massive oil spill in the Gulf of Mexico, echoing similar moves by sister company Fannie Mae (FNM) a day earlier.

http://online.wsj.com/article/BT-CO-20100617-711788.html?mod=WSJ_latestheadlines

ATVI Inverted H&S Targets $12


Disclosure: I am long ATVI

Tuesday, June 15, 2010

Crude Oil's Bear Flag


Crude has created a picture perfect bear flag as seen in the weekly chart. Crude’s failed breakout and reversal during the week of May 7th saw futures make a new high for the year of $87.15 before reversing to close down to $75.11. A 13.8% correction ($12) drop in one week. Following this reversal, oil continued its slide making a low of $64.24 retracing more than 38.2% of its move from $33.20 to $87.15. Crude has pushed off the lows set May 20th and has tried to rally for the past 3 weeks, testing resistance and the top of the bear flag $76-$78.51. On the daily chart, crude is trying to break outside of a bearish pennant, this is seen as a false break out as long as prices fail to close above $76.00. An opportunity for bears to sell at these levels, risking a close above the highs, and looking to target the 50% retracement level of $60.00. Bulls should look for a close above $76.00 then $78.51 before attempting to position on the long side.

RISK DISCLOSURE: PAST PERFORMANCE IS NOT INDICATIVE OF FUTURE RESULTS. THE RISK OF LOSS IN TRADING FUTURES AND OPTIONS IS SUBSTANTIAL AND SUCH INVESTING IS NOT SUITABLE FOR ALL INVESTORS. AN INVESTOR COULD LOSE MORE THAN THE INITIAL INVESTMENT.

www.twitter.com/chicagostock

Saturday, June 12, 2010

Saturday Rock Blog: Jesus Left Chicago (for BP spill)


Disclosure: I am long BP but have sold front month $33 strike calls on all of it to lock in profits.

Thursday, June 10, 2010

Has Gold Double Topped?


Weekly chart above shows inverted h/s target 1240 completed.


Gold’s inverted h/s formation target to 1240 was completed during the week of May 14 after breaking out in April. Recently we have seen gold retest and reattempt to breach this target area by making a new record high of 1254.5. This new high was made during the Globex session on June 8th and tested during the pit session with a high of 1253.0. The fact that the break above 1250 occurred during Globex gives the impression that the high was made to run stops thus hitting 1254.5. The market tried to test this high but failed during pit session trading and closed at 1244.7. Since then we have seen gold pull back to the 1223 level, as seen in the daily chart, the uptrend is still intact, and gold is in a strong bullish trend, however gold has set a double top. This double top will remain strong resistance and a profit taking opportunity unless bulls can reclaim and close above 1252.

RISK DISCLOSURE: PAST PERFORMANCE IS NOT INDICATIVE OF FUTURE RESULTS. THE RISK OF LOSS IN TRADING FUTURES AND OPTIONS IS SUBSTANTIAL AND SUCH INVESTING IS NOT SUITABLE FOR ALL INVESTORS. AN INVESTOR COULD LOSE MORE THAN THE INITIAL INVESTMENT.


Sunday, June 06, 2010

Oil is looking bearish on multiple time frames

Here's a nine month daily:
I have a three year weekly below, if you view the whole move down beginning in 2008 as a simple ABC correction then you can come up with a target of about $20 on the ensuing leg C down for crude oil. For a more realistic, and useful perspective we should use the daily chart above and watch for a break of $70 to set up a target of $54. But it's always important to keep the "big picture" in mind:


Any way you slice it and allowing room for a replacement, crude looks to have topped for this cycle. Somehow the BP spill seems to have initiated a reversal that has really unfolded in recent weeks. This is a little counter intuitive to me because it seems like the spill raises the cost of production or in effect, reduces supply of crude. As supply is reduced shouldn't prices rise? Perhaps its just a coincidence that crude has fallen during the worst environmental disaster in modern history. I try and keep my focus on the charts and not try to guess how the market should react to some headline. Hope you are all enjoying this lovely summer weekend.


Disclosure: I own BP calls, no position in oil.

Saturday, June 05, 2010

Saturday Rock Blog: Scarlet Begonias 1977


Here I've got an interesting ratio chart (UNG/USO) that I came across this afternoon. After seeing natural gas have a great rally the past few weeks, even as deflation ruled, I was curious how it fared compared with oil. Don't read too much into this, these are both some of the worst ETFs out there, USO underperforms oil and UNG can't keep up with natural gas. I'd be expecting that rising wedge (red) to break down soon and resume the longer term trend down (falling 50dma below falling 200 dma). So the trade would be to short UNG and go long USO. That being said, Oil looks like it could be forming a long term top here, I'll try and post an oil chart later or maybe CS will. UNG/USO six month daily, enjoy:

Tuesday, June 01, 2010

Saturday, May 29, 2010

Saturday Rock Blog: I'm Gonna Be


Hat tip to the Benny and June fans out there, hope you are all enjoying this lovely summer weekend. Cheers!

Friday, May 28, 2010

QQQQ Head & Shoulders Top Forming


In watching the intraday action it feels as though there has been a major shift in sentiment following the 10% market crash we had a few weeks ago. In many of the daily charts you can see a pretty severe breakdown on that day followed by a series of bounces within continiued selling. The technical damage was severe on that day; for example, the Q's broke their 2010 low from back in February before reversing and many former leaders have since broken even lower. It feels as though the 2008-2010 bull market is ending and a new bear is about to reassert itself. In my view a new bear market has not been confirmed technically. On the Q's above I see a head and shoulders top forming with a neckline at $42 that targets around $33.35. The right shoulder is a bit messy and starts on "glitch day" the way I have it drawn but perhaps we still haven't finished the head yet. I am looking for a close below $42 on a weekly basis for a confirmation of a new bear market in tech stocks and completion of this H&S pattern. As far as the recent bounce/rally of the past few days, I think QQQQ could see at most $47 but it appears to be running out of steam right here ~$46. From here that $42 will be a magnet and a good test to see how badly the bulls want to own stocks.

Disclosure: I don't have a position in QQQQ at this time.

Monday, May 24, 2010

What drives us?

Sunday, May 23, 2010

Revisiting the Euro / Aussie Dollar cross

Hey, I hope you've all had relaxing weekends and are rested up because I think this week promises to have some juicy action in the markets. Its not so bold of a thing to suggest really, given that we had a 10% crash a few weeks ago in a span of minutes or the various global crises happening at the moment. There's the BP catastrophe in the Gulf, N. Korea is sinking submarines , Bangkok is in flames, the EU might dissolve; its starting to look like another credit crisis is brewing. This has created all sorts of action for traders as this volatility rapidly transfers wealth around the planet. Oil tanked while gold soared, global stock markets trended lower. So its really no surprise that there has been significant "fluctuation" in the foreign exchange as well.

Our good friend the Australian dollar (AUD, FXA) plunged as investors sought less risky US dollars because commodity producers declared they are pulling out in protest of new mining taxes. Here's an AUD weekly chart, I think it looks pretty similar to how it did about two years ago:


I mean, it doesn't really get much more bearish then this. You have AUD slice through its 50 and 200 dmas ina week. The CCI and stochastics scream "sell." And finally AUD plunges below that keep support from early last February around $0.86. The measure rule for this move targets $0.77 to $0.78 but I think it could easily go much lower in time. On this last push that just topped out AUD couldn't take out its former high from the bull market that ended in 2008. To me this establishes a long term secular bear market for the AUD, I got short AUD at the end of last week.

The euro (EUR, FXE) basically did the same thing AUD is doing right now about six months ago and we all know how that turned out. EUR has steadily declined on the EU crisis, even sending the "one currency" sliding through its 2008 low. You can clearly see the lower highs on this weekly EUR chart but I think there are signs of hope in the shorter term. Notice that while EUR clearly broke its 2008 low, it managed to rally back and finish last week well above this key level. The weekly EUR chart now has the "false break" we have all come to know and love, potentially this could get shorts to take profits while panicking dippies to get in before the pop:

On this weekly time frame there's not a whole lot to hang your hat on but I really like last week's inverted hammer candlestick, a sign of potential reversal. If you check out the FXE volume you'll see that last week's was the highest ever, far eclipsing the volume during weeks of the 2008 credit crisis. A surge in volume signals capitulation to me and so I've been slowly adding EUR. I might point out that I did correctly call the top in both AUD and EUR in this last cycle but it seems I was early on the AUD decline.

Each of these trades individually would result in significant US dollar exposure but if paired with equal size then the dollar risk is hedged out. In the Forex world this is a trivial concept, you'd just buy the EUR/AUD cross. After a quick glance, the chart for this cross effectively takes the best components of both above charts and brings them together. EUR/AUD had been in a narrow and declining channel for about two years. The RSI was steadily declining then all of a sudden last week, bam! EUR/AUD broke out closing the week at nearly the high with a 7% weekly gain, that's a huge move for a currency. The CCI and stochastics have not confirmed buy signals but seem on the verge of doing so. I could easily see this cross getting back to the 1.7 area which seems to be a sort of three year "equilibrium."

If you're not into the forex or don't have an account you can still take advantage of this trade albeit with much much less leverage. To do this trade with ETFs you can go long FXE whilst shorting FXA which is technically what the chart above is. To get leverage you could buy options (FXE calls, FXA puts) but frankly the forex market is much more liquid and enable much higher leverage. I do have to point out that I was wrong on this cross in February when I thought it was forming a bottom at it's 2007 low. That being said, if this cross really melts up I could see it going to my old target around 2.0.

Anyways, good luck out there this week. I'll try and get some new stock charts up soon. I'm generally getting pretty bearish on the market but I don't have and puts or short positions right now in stocks. The potential for a big capitulation bounce scares me but almost every index chart I look at is a sell.

Disclosure: I am long EUR/USD and short AUD/USD.

Friday, May 21, 2010

Saturday Rock Blog: Llama


What an incredible past few weeks; wow, just, wow. Sorry for the lack of posts, I promise I'll make it up soon with an epic post. For the meantime enjoy this epic youtube video along with this QQQQ chart!

Wednesday, May 19, 2010

05/19/10 SP500 & Crude Oil Market Update


The SP500’s failed move past 1175 created a new head and shoulders formation with a range of 53.25 handles (1174.75-1121.50). The market closed below its neckline (1121.50) on Tuesday weakening the market into the Globex session to make a low of 1106.00, filling the gap from the May 7th (1107.00). Now that this gap has been filled, the market can attempt to fill back higher and try to reclaim its losses. Resistance will be met at the neckline of 1121.50, then the intraday pivot of 1122.63-1131.38. The top of the 3day pivot for tomorrow is at 1136.13, close to the previous h/s target of 1136.75. Failing to hold this gap area gives this current head and shoulders formation a potential target of 1068.25.


Oil’s failed breakout after making a new high on May 3rd of 87.15 has now seen an almost $20 move to the downside in less then 3 weeks. The saying that false breakouts lead to fast moves was proven as the market quickly came down to test the bottom of its weekly channel. This channel was taken out last week with a close of 71.61. This week, the June contract is going into settlement on the 20th, and a low of 67.90 has been made reaching toward a 38.2% Fibonacci retracement from the January 09 lows of 33.20 to the recent highs of 87.15. Crude is down 6 days in a row; this trend will be tested tomorrow as the EIA inventory numbers will be released and bulls look for oversold conditions. Resistance: Intraday pivot range 72.96-73.71, 3 day pivot range 73.55-75.48.

RISK DISCLOSURE: PAST PERFORMANCE IS NOT INDICATIVE OF FUTURE RESULTS. THE RISK OF LOSS IN TRADING FUTURES AND OPTIONS IS SUBSTANTIAL AND SUCH INVESTING IS NOT SUITABLE FOR ALL INVESTORS. AN INVESTOR COULD LOSE MORE THAN THE INITIAL INVESTMENT.

Saturday, May 15, 2010

Saturday Rock Blog: The Horror (Euro)


Disclosure: I am long the euro, this is a panic.

Saturday, May 08, 2010

Saturday Rock Blog: Back to You (ICE)


Disclosure: I own ICE calls.

Friday, May 07, 2010

Thursday, May 06, 2010

Glitch Day 2010 or How The Dow Tanks 1,000

Welcome to glitch day 2010, did anyone see a black cygnet swim by? No one seems to be able to nail down one single reason for today's historic market calamity but was it really all that surprising and unprecedented? Back in 2008 the market would drop 10% in a day once every few months. After this ridiculous rally we've had who out there really expects us to just keep going up even as global economic news is awful. I heard one trader say that today he was watching the Greece riots live and as soon as the police advanced on the crowd the market tanked. Others are watching the euro collapse to multi year lows. Yet others are following the financial reform debates in Washington or anticipating the next class action lawsuit against market master Goldman Sachs. Myself?, as you know, I try to remain focused on the charts so here they are. Mostly, things seem unusual on short term time scales but not so much as you zoom out. First, here's my updated six month QQQQ chart from Wednesday morning:


Many strange things seemed to happen simultaneously today just before 3pm, one of them was the plunge in the shares of blue chip and dow component Procter & Gamble, PG:


Undoubtedly fortunes were made and lost in the action...


Apparently some stocks dropped to zero today before rebounding, literally. In fact, so many stocks did this that the Nasdaq had to release a long list of stocks which have canceled trades. PG does not appear to be on this list, here are a few stocks that had severe drops today from this source:


To keep some perspective, many stock charts seem to be reasonably unaffected. BIDU's long and shorter terms are still up, if any thing this gap fill for BIDU was healthy:


To be fair, the "glitch moment" in the day only lasted about 30 min. As you can see by this 5 min XLF chart, the market was already tanking pretty bad before we broadly crashed. XLF took a bigger dip just before 3pm but it seems pretty orderly and healthy:


We'll just have to wait and see what happens tomorrow with the unemployment report and any hangover from today. I am moderately bullish at the moment in the short term, becoming increasingly bearish on the long term.

Disclosure: I currently have only bullish positions, including but not limited to QQQQ, ISSI and CRUS.

Wednesday, May 05, 2010

Its just a chart!! (IWM to $42 & a Broken QQQQ)


Disclosure: I own IWM and QQQQ puts. Click chart for higher resolution.

Saturday, May 01, 2010