Wednesday, September 12, 2007

The Next Risk?

This excellent article from the Associated Press describes what could be the next stage in the on-going credit crunch.

In a nutshell, large numbers of people are having to choose what bills to pay off, and for now they are paying off the high interest rate credit cards, rather than paying their mortgages. The old trick of borrowing against equity to pay bills is no longer an option. One excellent quote?

"The appraised value (of the house) didn't come high enough to consolidate our bills..."

Ouch.

The credit related problems are not just in the mortgage backed securities any more. The riskier class of "asset backed commercial paper" often consists of securitized credit card debt, and any defaults could cause yet another wave of restricted credit.

And while I'm posting today let me offers kudos to Pythagoruz for his August 30 call and chart on the US Dollar. We're not quite in free fall, but it won't be long, in my opinion.

Sunday, September 09, 2007

Rolling Over

A number of leading stocks appear to be rolling over right here and the not-so-leading stocks look even worse. One leader from the first half of this year is AFSI, the chart was a beautiful long until it hit a high of 22.08 in early July. It has formed a perfect 50% retrace (22->12->17) and now looks ready to resume the correction lower:


I haven't looked into earnings date or fundamentals on this one so be sure to investigate for yourself before taking any action. Just looks like a nice short set up is all.

Thursday, September 06, 2007

ICE is About to Bust a Move

A break (close above/below) of either blue line in the daily symmetric triangle should lead to a $30+ move, my guess is down. Thats based entirely on the chart with the recent failed cup n' handle, severity of the breakdown a few weeks ago and other indicators pointing lower. Although, as far as I can tell the fundamentals say higher.


Time to test par?

Monday, September 03, 2007

American Trading at TD Ameritrade (AMTD)

After breaking badly back in July, AMTD made a good effort on Friday to get back above its 50 day moving average at 18.17. Unfortunately for TD Ameritrade investors, the stock closed at 18.15 (two cents shy) and it may be poised to resume the downtrend. Take a look:


What I like most about this chart is the look of a bear flag/rising wedge pattern that has formed over the last few weeks. The stock has essentially retraced 50% of the decline from the recent high at $21.31 (which was a lower high than the 2006 peak at $23) on a bounce from a new 52 week low at $13.82. During this move from the low a few weeks ago the volume has declined and we now have what appears to be a low risk entry. I'd place an initial stop around $18.50, which should be lowered as the 50 dma falls. The bears have complete control of this stock while the 50 dma is declining and for that to stop happening the bulls need to close AMTD above that level for some period of time.

Any thoughts on TD Ameritrade's business going forward? It seems to me like the "little guy" traders must be getting cut up in this market and we aren't exactly seeing a booming stock market to attract new retail investors. If the average American does start to feel the pinch from a declining housing market you can bet they will tap into their savings which means less commissions for AMTD. The only area that I would be worried about is the possibility of a merger with E-Trade as I'm not really sure how that would effect the stock price. Otherwise I'm not a big fan of their service/product, thats why I switched to Interactive Brokers.

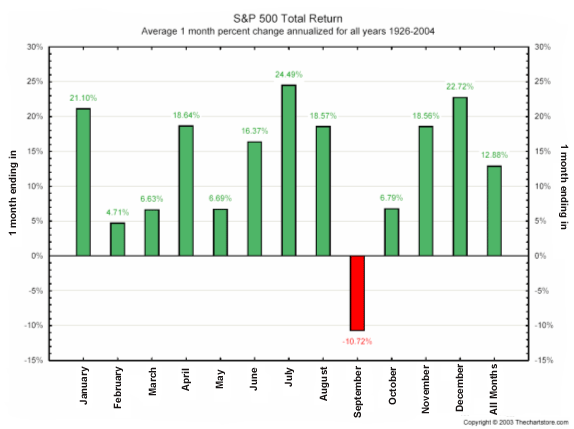
In other news, hooray for September, the only month to historically have negative returns on average.

Thursday, August 30, 2007

Tastey Charts for Carnivores and Honey Lovers

I realized today that bulls are herbivores. You know, their favorite snack is grass and so they generally don't have good taste in food. Bears on the other hand love their meat and aren't afraid of fighting off a few bees for a pound of honey.


Interesting Option Activity.
VIX/SDS Ratio Indicator.

Disclosure: I own CAT puts.

Tuesday, August 28, 2007

The 100th Post

It is my pleasure to bring you the centesimal post on Stock Geometry! Since the first post here on May 24th 2006, the other contributors and I have been calling em like we see em with a high success rate (AHM, CCRT, DDS, COF, JASO, OMR, DECK, CREE, LEND, etc). We haven't been right on them all but its the mistakes that we learn the most from. While this site was originally started with purely chart interpretation in mind, it has developed into more of a hybrid of fundamental and technical analysis which I believe to be the most profitable method. In honor of the occasion, I wanted to fill you in on some of the technicals and fundamentals of the site its self, here's some data on the last 6 months:


As you can see, the readership is still quite small but has been increasing even during the typically slow summer months. Currently, the biggest days for the site are when there is a link posted on yahoo finance or other blogs. Thats when we get the most attention, so thanks for spreading the word. Theres a bunch of interesting info in the pictures above and below for the web 2.0 nerd types like me, just click on the pictures to zoom in (as usual). Below you can see the geographic distribution of the readership:


I've got it broken down by city and country there. A few notable cities are Urbana, IL (where I live), Santa Barbara (where I use to live and betweenthebars lives now) and Aachen, Germany (where indigo-alien lives). We also seem to have some frequent readers in New York City, Louisville, Pleasanton and Vancouver. Those of you who we have not met, please introduce yourselves!

I think the three of us contributors agree that we get just as much out of the process of writing on this blog as we do reading each other's work. The idea here is to share thoughts on the market in hopes that we can learn from each other. There is no ulterior profit motive here, note the lack of advertisements, and I hope it stays that way. Fortunately, google provides this great blogspot service for free along with the service I used to generate the above data called google analytics. So a big thanks to google. I also wanted to take a moment to thank the other contributors, Ian (indigo) and Vince (btb) for making this such a fun and educational project to be apart of.

Going forward we don't have any big plans at the moment. I am pretty happy with the ways things have evolved with one small complaint, it would be great to see more feedback in the comments. Even if it is just a short note about a chart, some news that was overlooked or even a missspelled word, it is greatly appreciated. I'd really like for this to be more of a two way process between the bloggers and the readers. Thanks to all of those that have commented and I'm sure the number of comments will grow with the traffic.

If you are interested in keeping up on non-market related activities that we have going on , Indigo and I both have other blogs which you can find the links to on the right hand side of the page.

Ok well, congrats Stock Geometry on 100 posts! Now for the next 100! Thoughts?

Thursday, August 23, 2007

S&P 500 is more volatile than the Nasdaq?!

A new and unusual trend is developing with the nasdaq volatility index falling (VXN) below the S&P 500 volatility index (VIX) as seen in their ratio (see below) being less than one. Is this the beginning of a period in which we see more volatility in the larger cap industrials, I doubt it. More likely its just due to a recent repricing of risk in the financials which are a much larger component of the S&P. This is telling us that in general buying options on nasdaq stocks is cheaper and more attractive than on S&P stocks. Or conversely, selling options is more attractive on the S&P. Anyhow, this is a rare event historically and worth thinking about in my opinion.


Disclosure: I own QQQQ puts

Wednesday, August 22, 2007

Dollars looking for a home

I voted "No" in the recent StockGeometry poll on "the top of the market". As I wrote in this article, the markets are being force-fed money that has to be invested somewhere.

New proof of this can be seen in a Tuesday article published by Reuters. To quote the article;

"Experts are reassuring investors that U.S. money market mutual funds, which have gathered about $165 billion in new assets over an eight-week period..."

and,

"Money market mutual fund assets stood at a record $2.7 trillion on August 15..."

And given that billions more dollars have been injected to to the worldwide banking system, you just have to think that some sectors of the stock market will respond positively.

Hey, Budweiser still makes a lot of money brewing beer, and they don't seem to be having any difficulty raising funds by way of a bond offering. In fact, the size of that deal was raised from 350 million to 500 million, and I don't see where any other terms were changed. And all the usual suspects were lead brokers on the deal.

Rio Tinto recently posted quarterly earnings in the billion dollar range, and I'm sure they'll keep doing so. The company is always looking for acquisitions and in April they completed a deal on an Australian coal miner. The usual suspects are no doubt "standing on the sidelines" waiting for their next deal (now if the company would do something about their website).

And just to round things out, Johnson and Johnson still makes just about every product you really need in your bathroom and they make a profit doing it.

No, these are not sexy stocks. And it could be argued that many Blue Chips have been dead money for the last couple of years, but if you're looking to own quality, with no exposure to the sub-prime problem, I would argue that you could find many, many examples just like Johnson and Johnson.

Saturday, August 18, 2007

Another German Bank is involved

I've known about this investigation for about week. The Spiegal.de (spiegal = mirror) website made a solid reference to this situation on the 13th of August.

I have no idea how this will affect trading tomorrow.

To be honest, I suspect that this bit of information will be ignored, in the midst of the ongoing information storm.

Thursday, August 16, 2007

I'm not bearish on all stocks... [REDUX]

I didn't expect that move today, but then again if the market were that easy we'd all make money. And we all can't make money because who would we make it from? Anyways, the stocks I was buying today:


And JASO, I think it just needs to recover 30$ tomorrow after a breakdown/shakeout today. Frankly that stock was strong as hell today even as hedge funds dumped it. It was down as much as 9.1% but repeatedly returning to positive territory and was even up a few % at one point. Here's an updated chart:

Simple ABC Correction?


Well that was one hell of a day, what an awesome move for options expiration! So does that complete a simple ABC correction? All major indexes have pulled back >10% and there was a huge bullish reversal today on record high volume, note the hammer candlestick. I have included Fibonacci values for the moves in SPY and DIA as possible areas of resistance/support. My personal feeling is that this is the bulls last stand but we'll have to see what they can muster up. I'll be very surprised if they can turn this thing around and will be looking to re-enter shorts at the top of the B move or lower if necessary. Perhaps the 38.2% pullback on this move. For now however, I am long JASO and ICE. And if that was a simple ABC correction, then we are now supposed to resume the bull market and make new highs. I think this is more likely the 1,2 & 3 of a 5 impulse Elliot wave (since I think we just started a bear market based on fundamentals). Any thoughts?

Tuesday, August 14, 2007

I'm not bearish on all stocks...


The two sectors that make the most sense to me fundamentally are international growth areas like China and energy related issues (which are international typically). Combine these two sectors together and what do you get? JA Solar (ticker: JASO), a Chinese solar cell company that did an IPO about 7 months ago. This is a stock that I highlighted back at the beginning of the summer when it was 24, that was before it doubled and has now pulled back. Well I still like it, and it is still in a strong uptrend. Furthermore, earnings were great and an analyst upgraded the stock last week following the numbers.

Disclosure: I own JASO calls

Monday, August 13, 2007

Stock Geometry Readers Call THE Top

Tonight the poll ended with 44% of voters choosing that yes, the bull market is over. The exact results are below with the second most popular choice being that this is a short term top, 10% correction. I have to say that now, after all that has transpired in the last few weeks, it isn't surprising that most people call "a top" since we did get a big decline. But in fairness, the results have only changed marginally since the poll began three weeks ago.


I should note however, only 25 people voted in the poll which was a pretty small sample space. I checked on google analytics, a neat free service that tracks all the traffic at the site (yeah I just said "neat"), and it showed 300 unique visitors during the three week poll with 588 total visits and 972 pageviews. In other words, less than 10% of the readers voted. Well now we have something to improve upon, this was the first poll after all.

Anyways, I just wanted to get it on record that you had predicted THE top in the stock market. We won't know that this is a bear market until after we are knee deep in it, but where is the fun in calling it then? Only time will tell, and we'll be watching.

Sunday, August 12, 2007

Jump into the Mortgage Companies for Op Ex?

Ok, ok, so I must be looking a little bipolar talking about going long mortgage companies after my rant about how bad housing is and that its going to get worse earlier today. And before I continue let me first say that I am in no way attempting to give financial advice here, just talking about a few thoughts I had about the markets. Buying mortgage companies for the long term is financial suicide and even buying them for a few day trade is EXTREMELY RISKY. These guys are dropping like flies and at any point one could file for Chapter 11 and the stock gaps down 90% like AHM did.


That being said, this is a trade that I made back in March and have been looking forward to for weeks. The timing is crucial and you better have a tight stop if you are going to attempt anything like this. But I wouldn't be surprised to see 100%+ upside moves in stocks like NFI, LEND, LUM, RDN, IMH, etc, etc. Comment on this post and I will mention a whole slew of other candidates.

Heres the idea. It has been impossible to get shorts on these stocks for months, and in some cases like NFI, for years. But alot of people have been making money on the downside, in fact gobs of it, how? They bought puts. Now they are sitting on massive profits over the last month as these stocks have been in free fall. Furthermore, much of the profit has come in the spike in implied volatility that shows up in the premium the options have based on time till expiration. In some cases the puts on these stocks have the highest implied volatilities I have ever heard of, ridiculous numbers like 200%+ on NFI options (see plot above). That compares with 20% ish on the QQQQ (nasdaq 100 etf).


When someone buys or sells an option it has more or less the same effect on stock price as trading the stock it's self. Buy a ton of calls and a stock will go up as the option market makers buys stock to hedge himself and lock in the profits from the sold premium. Sell the call back and the market maker has no reason to hold the stock anymore, hence selling the stock. The same goes for puts and I expect a ton of puts to be sold next week as traders lock in profits before their puts expire with no time premium left. You might be thinking, well how can the market maker short the stock (when someone buys a put) when everyone else is unable to borrow shares. Well there is a neat trick they have called naked short selling. Thats where they sell stock that is not borrowed. It is illegal for most market participants to engage in the practice of naked short selling, but there is an exception for option market makers on the basis that it is only temporary (since the options expire). Neat huh, kinda makes you want to be an option market maker.


So as puts are being sold hand over fist next week on stocks like NFI, LEND (which was down 50% in the after market on news you can read if you care to) and others the option market makers that sold them will cover the stock they are short. You see, option market makers are not in the business of speculating. All they want are those big fat juicy premiums they get by selling options, so they will not want to be short these stocks as people sell back the puts.

I've posted a few charts here of stocks showing how they reacted to options expiration back in March after a similar down fall occurred in these share prices. Some never recovered and went bankrupt, like New Century Financial. But others showed ridiculous intra day moves to the upside. LEND went from 3.77$ to $13.75 in three days, for example. So just take a look at these charts and notice what happened in March. I'm thinking NFI and LEND will be the big movers this week, but we'll just have to see.


As a cautionary note, buying calls on these stocks is expensive and risky especially this close to expiration. You have to watch the implied volatility in real time because the volatility is so volatile. In other words the stock could go up 20% and the calls go down because you bought at the wrong moment. This is a very tricky situation to be trying to trade options on and if you were going to do it, I would think the ideal play would be to short the puts (which is also very risky). Long story short, if these stocks make the types of moves I am expecting this week you will be able to get plenty out of the stock movement. Although, some LEND calls I bought back in March showed me 1,000's% profits in a few days. Yeah.

So I hope you don't mind a little Sunday rock blogging, a phrase I got from a new favorite blog of mine: Calculated Risk. Hoping for a big jump in the mortgage lenders next week after a nasty start so I can get into some positions. Would Running with the Devil be more appropriate? Maybe later this week.


Also, the poll (top right) will be closing at midnight tomorrow (Monday) so if you have not, please take a moment to vote. So far the readers are predicting a bear market and I want to be able to say you called it, if thats what transpires. Good luck, and be safe.

Home Prices Plunge 50% in Florida Home Auction


We all knew the housing market was in big trouble but -50% in months, good grief! What is happening is that the housing market topped to end a 10 year bull market in real estate (stating the obvious here). At some point a fundamental limit must have been reached as way too many homes were being built and sold to people who simply couldn't afford them. Foreclosures began to spike in the last 6 months as three year adjustable rate mortgages from the later stages of the boom began to reset to higher rates (see chart below). So now all of these homes that were starting construction in the peak of the boom are on the market while banks try and dump foreclosed homes at the same time. In that story in the video above, it sounds like brand new homes were being auctioned off as fast as possible by the builders/developers who panicked to get rid of their inventory of unsold homes. The already weak market is getting whacked by liquidation of foreclosed homes also, as seen in this news clip about CA foreclosures:


For many homeowners who purchased in the last few years this has led to a state called upside down, where people have negative equity on their home. I don't see how this can be good for the consumer who accounts for 2/3 of our economy, recall the wealth effect. The worst part about it is that we are only in the early stages of a multi year process of mortgage interest rates reseting higher (see below). Ignore the collapse in real estate at your own peril or if you want some upside on the crash CFC puts should do well. When you have time, take a chance to watch Bill Moyer's look at the current crisis hitting the financial markets and how it all started with the housing bubble. Bill Moyers Part 1 , Part 2. We are just in the early stages of this thing people.

Many things are on my mind this weekend, I'll post some ideas on individual stocks later tonight.

Thursday, August 09, 2007

And in all fairness...

These headlines will provide a great reason to worry about the health of the global market, today. But only today. tomorrow, it will be something else.

BNP freezes $2.2 bln of funds over subprime

Futures slide, subprime woe rattles markets

BNP trouble hits stocks; ECB helps money mkts

Goldman Denies Global Alpha Liquidation Rumors

and finally, David Lee Roth to tour again with Van Halen

David Lee Roth couldn't get a loan either, so he has to go back to work!

Sunday, August 05, 2007

CAT Puts Are a Better Way to Short the Dow Jones

From a purely technical standpoint, the broad market and many individual stocks are headed decisively lower. As you can see in this Dow Jones Industrial Average weekly chart below, the index has broken and closed below previously strong support in the 13,250 area. Using a Fibonacci 61.8% pullback one gets a target of 12,735, the 40 week (200 day) moving average lies at 12,817 and the prior high in February was 12,796. So I'm going to average these targets an round up to suggest the Dow is headed for 12,800.


Now the federal reserve is meeting early next week with their statement at 2:15PM Tuesday but there is no economic data to be released Monday. I'm thinking the momentum we saw Friday will continue Monday and some may be trying to pressure the fed (via a broad market decline) into a rate cute or at least towards a change in bias towards a cut later this year. Of course this is speculation, but with Cramer begging on TV for a rate cut there are clearly those who are desperate to get one. However, if the fed raises rates or talks about sympathizing with the bond speculators who are loosing their ass right now, we may see a powerful short covering rally Tuesday. For this reason I suggest you keep tight stops on all shorts.

There are a few ways to play this decline, but my favorite is to buy puts on CAT. I mentioned CAT a few weeks ago as a short which worked out great. After a dead cat bounce (pardon my pun) the stock was able to briefly regain it's 50 dma before closing below it once again on Friday.


The reason why I like shorting CAT as a way to play an industrial decline is threefold. First, they reported earnings a few weeks ago that disappointed wall street with an unexpected 21% earnings per share decline. CAT is somewhat levered to residential construction in the US, which is part of the reason why earnings were so bad. Second, CAT is one of the 30 DJIA stocks and was until recently the second biggest gainer in the group for 2007. So it trades very closely with the index which I believe to be headed lower. Finally, the options on CAT are highly liquid and have a relatively low implied volatility (they are cheap). Volumes are typically in excess of 1000 on near the money contracts and spreads are frequently less than .05. You can get in and out of those options quickly without having to pay a spread penalty.

From the weekly chart above you can see how CAT has broken it's 10 week (50 day) moving average after a sustained rally a few times in the last two years (I've circled those breaks in blue). In each case this break was followed by a test of its 40 week (200 day) moving average in 2-3 weeks. The indicators and candlesticks looked similar in those situations to how CAT looks right now and based on the CAT chart alone I would say it 's headed to at least $70. However, since CAT trades so closely with the DJIA, I would sell those puts when the DJIA hits 12,800. Although, its worth noting that my target on the dow is it's 200 dma and my target on CAT is it's 200 dma, so why shouldn't these events occur simultaneously? If they both reach their targets CAT will have fallen substantially further on a percentage basis, hence CAT is a better way to play the drop in the dow.


As a side note, the glorious momentum stock DECK has lost it's momentum and fallen completely off the IBD 100 after being number #6 just two weeks ago. This stock is still above 100, a miracle of miracles for the longs who own it, and I think it is about to get slammed big time. Especially with the growing concerns that consumers are going to feel the pinch with all thats going wrong with credit and housing, investors may be seeking to take profits on this low floater. Tough decision: Pay mortgage or buy a new pair of UGG sheepskin booties...

Any thoughts on the new logo? Comments on the poll? If you haven't yet, please take a moment to vote in poll on the right. There are many more people stopping by than have voted. Happy trading next week.

Disclosure: I own DECK and CAT puts.

Saturday, August 04, 2007

CRAMER nlod (new low of the day)


Jim Cramer was in panic mode Friday on CNBC as the market continued its dramatic downtrend in the late afternoon. He said things like "we have Armageddon" and "Bernake has no idea what its like out there." He seemed to contradict himself more than a few times and was clearly not thinking clearly. Certainly Cramer is frustrated with the market, or rather, frustrated with how poor his calls have been about the market (see NYX, his growth stock of the year). So this latest episode may not be such a surprise in that context. It makes one wonder how much longer he will remain on the air. If you don't know what Cramer is talking about in this clip, then you might want to take a look at this article he wrote Friday morning. We've all known that Cramer was a clown, but this is a new low for him.

Friday, August 03, 2007

The Sub-Prime Problem is not just an American Problem

I read an article the other day that quoted Hank Paulson as saying that the sub-prime problem was largely contained. And while I agree with him that the repricing of risk and sub-prime credit is only a small part of the overall world economy, I wouldn't necessarily describe the problem as "contained", certainly not just to America.

Unlike most people I actually live overseas and I speak a couple of other languages. I go to the gym everyday and I get a complimentary copy of the Frankfurter Allgemeine Zeitung (Frankfurt General Newspaper, or FAZ) from them.

All week the FAZ has been running a series of articles on the IKB, a middle sized bank for industrial customers here in Germany. I'm not going to translate those articles, but suffice it to say that they are hyper-critical of management, calling for at least the removal of the Board of Advisors.

Current estimates of the losses at the IKB are running to upwards of 3.5 Billion Euros. So after a massive bail-out and other credit guarantees by the state run KfW, the criticisms are warranted. Most of these Board of Advisors positions are nothing but cushy political appointments for party apparatchiks, and the ivory tower types who hand out the doctoral degrees in this country.

And no, I'm not going to expand on IKB, or KfW. They are both something like 17 syllable words that nobody would fully understand. A lot of German words are like that. It's something you get used, eventually. As for the term "contained", I would suggest a look at the chart of IKB.DE, or its American Depository Receipt stock IKBDF.PK.


This article has been cross-posted to the authors personal blog www.indigo-alien.blogspot.com

Tuesday, July 31, 2007

Deat Cat Bounce Over.

Today was another sad day for the bulls as the markets clearly resumed their fast downtrend taking out the recent lows. Here are the intraday charts for future reference. Congrats to those who took my advice on the AHM puts, the stock closed around 1$ today from around 18$ just a month ago when I mentioned it. In fact, the collapse of this mortgage company was part of the reason why the market fell so hard this afternoon. More on that here. Now is the time to take profits if you have not. My new favorite short is DECK.

Sunday, July 29, 2007

Short the LBOs? (Leveraged Buyouts: DCX, TXU)


I was reading The Kingsland Report yesterday, as I do everyday, when he got me thinking about these recent private equity deals as possible shorts. I know it sounds crazy but the market is beginning to doubt the future of these buyouts with the target's stock prices falling well below the buyout price. Now many in the arbitration world see this as a boon for them, they buy the stock and get the difference when the deal goes through. And I assume they incur little risk by hedging themselves to be safe (with puts). As the credit market has become crowded with debt to be sold for these deals the appetite for debt/risk has fallen dramatically. This goes back to the worries many had months ago about the housing market woes and sub-prime problems spilling over into other areas of the economy. Well they did, in a big way. It has become increasingly possible that these deals may fall apart altogether which, in and of its self, would crash this market, among other reasons why the market may crash on Monday. Now for a few charts.


Diamler Chrysler recently announced they would have to postpone the sale of their Chrysler unit to Cerberus Capital because banks were having trouble financing their 10B$ portion of the 12B$ deal. Honestly I don't know exactly what this means for the DCX stock, but I do see a perfect head and shoulders top on the chart with an 80$ price objective. The August 85$ puts are trading for only $1.50 so if the stock does go to 80$ they will have a cash value of 5$, this gives the trade a nice risk to reward ratio in my view (possible 233% profit).


I thought the TXU deal, the biggest LBO in history, was done months ago. But as it turns out some greedy investors think that they can get more for their company and the banks must be praying that they get their way. This deal must be facing a number of hurdles in getting it financed and on Friday someone bought 10,000 January 2008 TXU 65$ puts for 2$. Thats a 2M$ bet that TXU will be below 63$ by January 2008 and the deal was priced at 69.25$. If 65.10$ breaks I can see TXU heading to its next support area around 62.50$ or maybe its 200 dma (61.50$) in no time.

Another one I noticed some heavy put buying in was HET. This deal must be a shoe in for the arbitration investors since HET is such a profitable fast growing company as opposed to TXU or Chrysler. But for whatever reason (which could be part of an arb hedge), investors bought 15,174 August 80$ puts around .40 Friday. Take a look at the HET chart, it is trading well below the 90$ offer and recently began to slip further. If even one of these deals falls apart you can bet the stock will crater and the other LBO stocks will probably tank in sympathy, keep an eye on the headlines.

I'll try and post more ideas later tonight. CREE continues to be a slow motion train wreck towards 20$. AHM has completely fallen apart and canceled their dividend, expect bankruptcy soon. CCRT, well I hope you got some puts in that one. IMB same story. I'm thinking Sprint (S) 20$ puts might be a good trade on Monday also. Also, Indigo had the great idea of doing polls each week to encourage feedback so please vote in the poll on the right. We are very curious what our readers think about this current market action. Good luck tomorrow, and please be safe (honor your stops!!!).

Friday, July 27, 2007

Its a top, but is it THE top?


Today it looked like the market was going to take somewhat of a breather until about half an hour before the market closed and Bam! That was the fastest, hardest end of day sell off I've ever seen and it resulted in all the indexes closing at their lowest levels of the day and the week. The daily charts are all now broken badly and many stocks look like death.

Thursday, July 26, 2007

Intraday Index Charts (nasty day in the market)


Today I really wanted to see what the intra day charts looked like back in February when the market had it's largest drop of 2007. Today felt almost identical to that day and in fact the pattern was very much the same with the fastest declines occurring around 2pm EST (when margin calls begin) and the bottom being reached about 30 min later. Today became the second worst day of 2007 but markets closed much higher than the lows of the day. For future reference or whatever else you might want to use these intraday charts for, here they are. Is this the end of the 5 year bull market or just a correction? Please vote in the poll on the right!

"Dow 14,000 we hardly knew ye..."

Wednesday, July 25, 2007

No, it's not a Top

Just to show you that we here at Stock Geometry don't always agree, let me say, "No, I don't think this is a Top, for a variety of reasons".

Just for starters, I happen to think that if you're going to start calling broad market tops you really ought to be looking at broad market charts. There are plenty of stocks out there that have suffered severe reversals lately, but a quick look at the DJIA, SPY, or QQQQ charts doesn't show anything quite so severe. Among these only the SPY is trading at its own 50dma.

In fact, of the broad market indicators only IWM is significantly below its 50dma. In my opinion these charts are showing us only a slight "move to quality". I wouldn't even use the term "flight to quality" here. This move hasn't been anywhere near so profound as that.

Quite frankly, these 4 charts are not telling me we've seen a top. As Brian Shannon of Alpha Trends likes to say, "The markets are innocent until proven guilty". And these charts are not guilty, by far.


In terms of market fundamentals it may be time to review a few things that chartists just love to ignore.

One of my favorite reads is Pimco's "Featured Market Commentary", usually written by Bill Gross monthly. I don't always agree with his conclusions either, but he is wealthy and he got there on his own. He controls a lot of other peoples money too, and besides that he's a reasonably good writer. It was in his February publication that he made it crystal clear to me why it is that the stock markets have been unstoppable for the last several years.

He said to the effect that, "Petro-dollars and the dollars from our trade deficit with China continue to be recycled back into our markets, without regard for price". That situation certainly hasn't changed since February. In fact, with the slow devaluation of the dollar, it's probably fair to say that an even larger total number of dollars are now being recycled back into the markets, still without any regard for price. I'm sure Bill Gross would love to be managing Chinas trade surplus. The rest of us should be thankful that he is not.

And there are other sources of dollars that are regularly invested, without regard for price. Huge numbers of dollars are regularly deducted from most people's paychecks and are then paid into various pension funds, mutual funds, or 401-k plans. Almost all of this money too is one hundred percent invested the moment it is received.

And finally, there is plenty of discretionary money available to be invested. When CD's and term deposits are paying only a few percent per year, it is hard to leave that money aside, particularly when many blue chip stocks pay that much as a dividend. This is particularly true at a time when the true rate of inflation is so very hard to judge.

And as for the the situation in the real estate markets, lets keep in mind that many of the former speculators have just had their favorite game taken away from them, and not all of them got caught with real estate inventory. Those with cash are now looking at the stock market as being "the only game in town".

And so the cash keeps rolling into the markets, without regard for price. Thank you Bill Gross, for a great quote.

Tuesday, July 24, 2007

Is this the top?


Hey all, I've been traveling and busy with some other projects so sorry I couldn't get around to posting on Sunday as usual. I think the other contributors have been on vacation lately too and why not! Its summer, time to kick back and catch some rays. But also I haven't been seeing many great setups lately and the market has been making all sorts of wild moves. This is by far the toughest market I have seen to trade. Fundamentally, it makes sense to me that this market should have crashed back in February as it almost did, but then like magic, the market reversed higher. Now, the credit/housing problems have really started to effect other areas of the economy and I would say again, the market should crash. Its as if the bulls have played dumb just to make sure that, in fact, a collapsing housing market would be bad for the stock market before giving up on this five year bull market. Miraculously, this market has charged ahead squeezing the shorts, leading to new all time highs in the the Dow Jones Industrials and S&P 500 while the Nasdaq has made new 6 year highs even as economic growth is the slowest it has been in four years. The bears have brains too big for their own good and the bulls played dumb squeezing the heck out of them hungry bears. Now the markets are in this state where everyone is scared, the shell shocked bears and the bulls who pressed their luck seem to all be confused about the direction. Is this the top of the market, who knows? At everyone moment the market seems like it is about to roll over and die, it plows higher like god himself is invested.

These times have reminded me to stick to my roots, to the chart, the only thing we can be certain of as traders. Letting go of personal bias about the market, even if this bias may be based on sound financial information (fundamentals) has been the hardest part of making money in the market for me. The chart never lies. A stock goes up because demand out weighs supply and buyers are willing to pay higher prices. The same stock will go down because sellers are more aggressive than the under-demanding buyers. Our job as traders to is sniff out the supply and demand by looking at the chart in anticipation of future price action. Now more than ever is is important to listen to the charts and accept whatever it is the market is telling us. I think Brian over at Alpha Trends and Trader Mike (see links to the right) are some of the best technical traders on the web for the broad market indexes and I suggest reading their blogs for broad market trends. What I hope to provide here are ideas about some individual stock charts since this has always been my strength. I will tell stories sometimes about the company's business prospects, but my best picks have always been chart plays. Let me just say that right now I see a heck of alot of charts breaking badly, even leaders like ICE. Is this the top, I don't know, but a ton of previously strong stocks are starting to look topped.

Take a look at CAT, whom until last Friday was the second biggest gainer in the Dow Jones Industrials for 2007. The stock had been a leader, in part, due to their healthy "global" growth business. But sure enough the housing slump caused them to miss expectations by a wide margin and predict hard days ahead. Enough with the stories, this stock is done. It broke it's 50 dma badly on record volume before a dead cat bounce (no pun intended) which has set up a sweet shorting opportunity. And by the size of the last two day's volume I'd say plenty are doing just that. I will be buying some CAT august $80 puts.

The rapidly growing and leading commodity exchange ICE had a failed cup n handle breakout last week, but watch for earnings :


Here's an island top on AAPL:

Partially in response to an earnings miss by Google, the rapidly growing Chinese internet giant BIDU is dropping fast:

Even my favorite solar stock in this red hot sector has taken a hit:
Now some of these stocks have reported earnings while others are due to report in the next few weeks (check for yourself, I know WFR, AAPL and BIDU are after the close Wednesday, ICE is Thursday morning). And these reports have the potential to outweigh any selling or chart breakdown, just look what happened to AMZN. The stock broke down today (below it's 50 dma) just before posting record blowout earnings after the close and the stock made new all time highs in the after hours trading. In addition, these stocks are leaders for a reason and it is typically unwise to bet against them. However, they are good barometers as to the overall strength and health of the market, the market's reaction to these companies earnings may be the key.


Any opinions, is this the top?

Sunday, July 15, 2007

Solar Squeeze (FSLR, JASO, LDK, SPWR, TSL)


The solar stocks have been on a rampage lately on increasing volume and many of them have massive short positions. The poster child of this rally is First Solar, ticker FSLR (see above), which recently had a big gap up and run on $1.3B in new solar panel orders. FSLR has formed what looks like a short stroke (no pun) on the daily time frame. This is a pattern you see after a big move where a stock consolidates mostly sideways for a week or so before blasting higher again. According to IBD, this pattern provides an "itty bitty opportunity to buy shares."

Since going public last fall the short interest in this stock has steadily risen. Theres no doubt that this will be a great short at some point, but lets wait for signs of a top first and until then the premature shorts will propel this stock higher as they take losses. I am very bullish on this stock above $119.85 (the all time high) which is conveniently just below $120 so this may provide a pause for the inclined to buy $120 calls before they go in the money. This level would then be a nice price to set a stop or for a longer term hold or a trailing 8% stop might be effective given the 8% range in the short stroke.

I'll leave it up to the readers to check out the charts of the other solar stocks like JASO, TSL, LDK and SPWR, but they all look very similar. They are exploding higher as the short interest grows. One stock that for the most part has not joined along that is in this sector is WFR. I have been bearish on WFR for a couple of months now but the chart is starting look good again after a few months of consolidation and base building. If WFR can manage to close above $67.50 things could get interesting. Based on a rough measured rule $85 seem like a good target once WFR starts making new all time highs.


On a few other notes, ICE broke out and looks like an awesome buy at pretty much any price as it marches towards my $210 target. In fact Investors Business Daily recommended ICE as a buy in the weekend edition of the paper. SWKS has earnings after the close on Wednesday and I will probably take some profits (but not all) ahead of that announcement even though I am still very bullish on the stock. AHM might be finding some support at $14 but who knows, that stock is a train wreck. I am also interested in IMB as another mortgage company short (like AHM and PHM). IMB seems to have more downside potential than the other mortgage stocks and the chart is begging to be shorted. Finally, Brian over at Alpha Trends had some interesting short squeeze ideas over the weekend. Check them out.

And don't forget that July options expire on Friday, so deal with your July's if you haven't yet!

Disclosure: I own ICE calls, SWKS calls, AHM puts and IMB puts.

Sunday, July 08, 2007

ICE Cup n' Handle


ICE looks ready to break out of a 4 month cup n' handle early next week after ICE said that they "decided over the weekend it wasn't worth trying to pay more for the CBOT (BOT) given the Merc's (CME) edge and its increased offer." Fears of a bidding war (which turned out to be warranted) ended a huge rally in ICE last winter and effectively formed a perfect looking pattern. I think ICE will breakout easy and the volume will confirm but if you want to be conservative I'd wait for $162.50 to be surpassed (don't be surprised if ICE gaps up there). Based on the measured rule for this pattern the target is $210.

Another chart I came across this weekend was what looks like a rising wedge in the Semiconductor Holders ETF with ticker SMH. This fund is comprised of the leading semiconductor companies and lately it has been outperforming. However, the rising wedge is typically considered bearish and based on Bulkowski's statistics it leads to a downward breakout 69% of the time. This pattern must breakout out up or down next week as the wedge will come to a point by then. See Bulkowski's site for more info.


And now a few other noteworthy points on previously mentioned stocks. As I suspected, CCRT did breakdown nicely last week on strong volume and looks to continue lower. If you missed the breakdown, CCRT looks like it may do a throwback so you may be able to enter shorts around $34.50. SWKS scheduled their 3Q earnings release for July 18th, recall I am expecting positive results based on the chart breakout, recent results and the iPhone. AHM shorts still look good. I think profit taking on JASO would be prudent here. WFR continues to trade in a channel about it's 50 dma. Finally, a significant correction in DECK must be near with it's weekly RSI at 92.42, thats the highest (most overbought) I have ever seen.

As always, please remember that you are responsible for your own trades and investments. This blog is not intended to be financial advice but rather some thoughts that I or the other contributors have on the market. Trading stocks and especially options can lead to catastrophic loss of capital, please be safe.

Disclosure: I own SWKS calls, AHM puts and DECK puts.

Sunday, July 01, 2007

Bullish On SWKS & A Few Bearish Charts


I came across SWKS in a less than typical way this weekend. Scanning the front page of reddit I saw this article in which the author dissects an iPhone. In particular, I noticed that one of the chips in the image seen above was made by Sky Works, a small cap public company I had briefly heard about. And so this got me checking out the company and the chart, etc, etc.

I did a quick search to see if this information (that their chip was in the newly released iPhone) was widely know and published. In fact this article was the only one that came up, and it is from last December. To quote them:

"We are highly encouraged by what we believe is an Apple win for many reasons," Acree wrote in a note to investors. "First, at about $2 per front-end module, this new customer could contribute meaningful upside. Second, we believe Apple's decision to use SkyWorks over competing module suppliers is a material technology endorsement that should be acknowledged by investors."

So it appears there was no solid evidence, albeit confident speculation, that a SWKS chip might appear in the iPhone until now. I was hoping that I could get this post out before there was a headline about it on yahoo, but this Sunday afternoon the news appeared. More on the "iPhone effect" here. When this rumor broke last fall the stock hit a high of 7.97 which it has been unable to break since and more recently the stock has hovered below resistance at $7.50. Take a look at the long term chart here and the 6 month chart below:


The technicals look strong on this stock with the 50 dma providing support just below at 7.13 (a good place for a stop loss) and is rising while above the 200 dma. The tight Boulinger Bands suggest a big move soon and the RSI says it can move up for a while before becoming overbought. Any close above $7.50 would be a nice breakout and above $8 a big breakout. But considering the iPhone news and strong chart I like it on any move above Friday's high of $7.52 intra day. The depth of the most recent base suggests a target around $9.50 which is close enough to $10 to aim there. If we view the longer term weekly chart as an inverted head and shoulders pattern then the breakout price is $8 with a target of about $12, so lets be mindful of 8$ resistance and get to $10 first.

I don't feel like playing analyst today, but a quick glance at their fundamentals suggests that the company is growing and strong. The stock surged following their 2Q results (last quarter) in which they earned .08 versus .01 the year before, meeting analyst expectations. Revenue was up 5% and they projected earnings of .08 to .11 per share for the current quarter. If we guess they make somewhere in the ballpark of .40 eps this year that would give them a current PE of about 18, which is cheap these days. I couldn't find a date for their 3Q earnings release, but based on their last report I would think it will be in late July.

And now for a few bearish charts, lets start with the good ole' S&P 500:


Ok, so its not the end of the world for the broad market, but we sure are looking closer to a longer term downtrend maybe to the 200 dma (a 5% correction). Many will say "well, we are in a neutral market because the S&P looks range bound" and it certainly looks range bound. But if we look at the highs an lows closely we see that in fact the index has made a lower low and a lower high albeit only slightly. Furthermore, the S&P has failed to regain it's 50 dma on several attempts (you know how I feel about a broken 50 dma) and it just seems like there are sellers lying in wait to distribute into any meaningful rally, for example on Friday. I expect last week's lows to be broken now that the second quarter is over and it was a great one for fund managers. They now have some profits to take after they wowed their investors in the 2nd Q (April-June).


I don't want to say a whole lot about this one other than that AHM has no support below from the past 3 years and the stock is in free fall. The stock spent Friday consolidating after they scrapped their yearly guidance citing a surge in mortgage delinquencies and offered no new guidance to console investors. There was also an analyst downgrade to underperform. I can imagine the next major catalyst to move the stock lower will be the cancellation of their dividend.

Also, I have been watching CCRT in the wake of the weak financial sector. I am surprised the stock has been able to hold up so well given their strategy of providing credit to poor credit customers. See my post on CCRT for more on that. But from a technical standpoint it seems to be set up for a nice breakdown soon. If it breaks it's 200 dma at $34.50 the next stop is $33 on the way down to the prior lows near $25. I haven't forgotten about that hedge fund called Second Curve that apparently has a large interest in CCRT and has been heavily invested in sub-prime companies (details here). In other words, another fund that could implode. Pure speculation on my part here. Here's the chart I'm looking at.

Disclosure: I own AHM July $17.50 puts