Friday, September 28, 2007

So how can we play this USD move?

The fact that the US dollar is under pressure is indisputable. On Aug 15 I moved a large portion of our family liquidity out of the US dollar, into the Euro. Since then the euro has moved from 1.346 to the dollar to almost over 1.42 today, and I expect this trend to continue.

In my opinion, the US Federal Reserve isn't going to have much choice with interest rates in the near future. Rates are going to have to come down to protect the US economy from the fallout of this sub-prime lending debacle. But at the same time the European Central Bank is facing an inflation problem here, and rates will have to be raised. It's only a matter of time.

Long term debt investors looking to increase returns will be buying Euros in order to invest in the European debt markets, and the volumes involved are more than enough to affect the Euro:USD exchange rate. As I write this, clever European exporters are hedging their USD accounts receivable and future sales against this likelihood. One way to do this is with CurrencyShare funds such as FXE. There is a similar fund for the Canadian dollar too, FXC.

As a retail trader who is not adverse to risk, it is my opinion that the options chains on these funds is the best risk/reward trade to be made today. As an example the FXE Dec 145 call are quoted at $1.05/$1.50. This, at a time when FXE itself has moved from $134 to $142 in just 5 weeks. There are 11 weeks ahead of us, before the December options expiry.

If you are concerned about the volume of trading in FXE options, you might be better trading the FXC options chain. Canada is Americas largest trading partner, so hedging and trading of the currencies far exceeds that of any other currencies. This means that spreads are narrower, liquidity is better, and trading should easier if the market goes against you.

Disclaimer: I have no positions in these products, at this time. But that could change today.

Thursday, September 27, 2007

ERTS Chart


This 3 year weekly is showing some improvement and what looks like a symmetric triangle breakout, volume is weak however. I was also thinking it could be a great Christmas for video games since everyone got the new consoles last year, including yours truly. I got a Nintendo Wii of course.

Wednesday, September 26, 2007

Slowing Consumer Spending

In another sign of the slowdown in consumer spending, orders for durable goods declined by almost 5% in August, the biggest decline in several months.

To me this is just confirms what I've been thinking and reporting on this blog recently.

In combination with that report on problematic credit card debt from two weeks ago, we seem almost certain to be coming to the end of "consumer spending as the basis for the American economy".

In the mean time, the vast majority of adjustable rate mortgages have yet to be reset, and foreclosures are accelerating. The Fed may have reassured the markets that they are attending to the situation, but continued "attention to the situation" can only result in reduced interest rates, and dollar exchange rates.

It's an interesting decision. Which is more important? The American consumer led economy, or the value of the dollar?

Monday, September 24, 2007

WFR Long Set Up

WFR is a stock that I was bearish on a few months ago when the steep uptrend in MEMC Electronics broke. The pattern began to look more and more like the Oneil proper short sale point with the stock vascillating about it's 50 dma. While the stock has been in this pattern is has consistently found support just below in the $50-55 range and it is about unchanged from where I became bearish. If WFR can break this series of lower highs and get out of the current range that its in, then there could be a nice move to the upside.


As you may have noticed, solar stocks have been hot lately (see JASO and LDK) as the demand for solar power is exploding. Currently the industry is unable to meet demand because there is a shortage of polysilicon supply, the primary semiconductor used in large scale solar cell manufacturing. MEMC Electronics (WFR) is one of the largest producers of poliysilicon and single crystal silicon in the world, so they stand to benefit greatly from the rapidly increasing price of the undersupplied polysilicon. In addition, the semiconductor sector has been showing signs of strength lately, so the stock may get some boost from that action too.


After doing a little digging I found out that the reason why WFR's run had paused was because they will miss expectations in the next quarterly report to be filed in November. They had some electrical problems during the expansion of one of their foundrys (material production plant). It sounds like an engineer hooked up a transformer backwards causing a brief power outage which led to a week long setback. If people are interested I can get into this into more detail, but generally speaking this minor setback should be viewed as a buying opportunity.


Ok, I usually don't like to get too deep into the fundamentals, but it just so happens that I actually know quite a bit about microfabrication as I am working on a PhD in electronic materials. Anyways, I think the stock is a buy on a clear close above that blue down trendline or during an intraday break of $62.50. The November $65 calls are attractive to me and I'd get out of those if the stock were to close below $55.

Wednesday, September 19, 2007

A new link in the Blog Roll

I'm adding a new link to the Blog Roll, in the sidebar. Minyanville.com gets my thumbs up for informed and balanced financial commentary.

As I live overseas and changes in the dollar exchange rates are particularly important to me, I greatly appreciate the sort of commentary from the likes of Todd Harrison. I've been reading his articles for a while now, and only just looked up his biography. He actually started Minyanville and he's an ex-TSCM type. Go figure.

As for his take on the dollar? This article explains it all. The title "Cracks in the Dollar", dated Sept. 13. Oh boy.

Monday, September 17, 2007

Self Similarity in SIRF


I love it when I see a pattern like this in a chart. Check out the CCI back in Feb and March on SIRF which has been in a steady downtrend all year long. The pattern looks very similar to the one formed over the last two months. If the pattern unfolds in the same way SIRF could fall by 1/4 in the next few months and easily break recent lows.

SIRF's 50 dma has acted like resistance the whole way down from $34 and may have just stopped this swing at $20. The next level of resistance would be near $22 where puts would be very attractive to me. If SIRF broke that red line connecting the highs I would bail, but otherwise anywhere in here looks safe.

Back in early April when the previous pattern completed, SIRF hovered below the 50 dma for a few weeks but never moved above. It then gapped down on earnings and has been below its 200 dma ever since.

Note, technically this is not self similarity because the size magnitudes of the patterns are the same here. In a true self similar stock pattern the 5 min time scale might look the same as the daily time scale. I think the phrase might still apply here somewhat though.

Sunday, September 16, 2007

Implied Volatility

Next week has the potential to be a wild one with the FOMC rate decision on Tuesday and September option expiration on Friday. Opinions about the stock market tend to be passionate and extreme right now. The bulls think that a big rate cut will explode the market higher on a monetary expansion by the fed and the bears see recession and more falling shoes, shoes bought with credit cards. It all seems to revolve around the fed and whether or not they are capable of saving us from the financial crisis that has been developing over the last six months. Whatever your opionion is, and I have my own, we can all probably agree that volatility is likely to be very volatile this week.


This is a very important fact for options traders because implied volatilities and hence the premiums are likely to be all over the place. In this environment it is more important than ever to be mindful of the option you are buying and how its pricing compares to historical and recent levels. A great resource for historical implied volatilities and their trends is IVolatility.com. If you buy an option on a implied volatility spike it can be deadly in a matter of minutes. You can watch the option drop dramatically in value even while the stock doesn't move an inch. I have found that a great way to protect yourself is to plot the option last, bid, and ask next to the recent stock price movement for comparison to the current pricing. You will see periods where the option price changed quickly, for example during a company announcement or at the beginning or end of the day. Those are the periods when you can either find a great bargain or get screwed big time. You can find implied volatility quotes here. I don't know of a free resource for intraday option charting but Interactive Brokers will do it and they also provide live implied volatility quotes. Also, if you want to see some interesting daily option scans, I enjoy perusing the IB Options Intelligence report each night.

The safest thing to do is to wait until Wednesday, after all the FOMC hoopla dies down, to trade September options. Or, just stay away from front month options all together, they do expire Friday after all. I have been very hesitant to trade at all until after this fed meeting is over with because market participants are so wound up about it.

But I do have a few ideas for the week.


GRMN has formed a nearly perfect rising wedge. I'll do a more thorough post about GRMN's fundamentals at a later date, but I find the bulls argument very uncompelling. For now, I think it should at least test that 50 dma and Bulkowski's measured rule suggests a target of $90 which still seems conservative to me. The pattern has to be confirmed with a close outside of the trendlines but that should happen soon with the apex approaching this week. The September 105$ puts could do well.

I had more ideas like SIRF for a swing trade, but I'm tired. I'll probably do another post after the fed meets Tuesday. Good luck out there!

Wednesday, September 12, 2007

The Next Risk?

This excellent article from the Associated Press describes what could be the next stage in the on-going credit crunch.

In a nutshell, large numbers of people are having to choose what bills to pay off, and for now they are paying off the high interest rate credit cards, rather than paying their mortgages. The old trick of borrowing against equity to pay bills is no longer an option. One excellent quote?

"The appraised value (of the house) didn't come high enough to consolidate our bills..."

Ouch.

The credit related problems are not just in the mortgage backed securities any more. The riskier class of "asset backed commercial paper" often consists of securitized credit card debt, and any defaults could cause yet another wave of restricted credit.

And while I'm posting today let me offers kudos to Pythagoruz for his August 30 call and chart on the US Dollar. We're not quite in free fall, but it won't be long, in my opinion.

Sunday, September 09, 2007

Rolling Over

A number of leading stocks appear to be rolling over right here and the not-so-leading stocks look even worse. One leader from the first half of this year is AFSI, the chart was a beautiful long until it hit a high of 22.08 in early July. It has formed a perfect 50% retrace (22->12->17) and now looks ready to resume the correction lower:


I haven't looked into earnings date or fundamentals on this one so be sure to investigate for yourself before taking any action. Just looks like a nice short set up is all.

Thursday, September 06, 2007

ICE is About to Bust a Move

A break (close above/below) of either blue line in the daily symmetric triangle should lead to a $30+ move, my guess is down. Thats based entirely on the chart with the recent failed cup n' handle, severity of the breakdown a few weeks ago and other indicators pointing lower. Although, as far as I can tell the fundamentals say higher.


Time to test par?

Monday, September 03, 2007

American Trading at TD Ameritrade (AMTD)

After breaking badly back in July, AMTD made a good effort on Friday to get back above its 50 day moving average at 18.17. Unfortunately for TD Ameritrade investors, the stock closed at 18.15 (two cents shy) and it may be poised to resume the downtrend. Take a look:


What I like most about this chart is the look of a bear flag/rising wedge pattern that has formed over the last few weeks. The stock has essentially retraced 50% of the decline from the recent high at $21.31 (which was a lower high than the 2006 peak at $23) on a bounce from a new 52 week low at $13.82. During this move from the low a few weeks ago the volume has declined and we now have what appears to be a low risk entry. I'd place an initial stop around $18.50, which should be lowered as the 50 dma falls. The bears have complete control of this stock while the 50 dma is declining and for that to stop happening the bulls need to close AMTD above that level for some period of time.

Any thoughts on TD Ameritrade's business going forward? It seems to me like the "little guy" traders must be getting cut up in this market and we aren't exactly seeing a booming stock market to attract new retail investors. If the average American does start to feel the pinch from a declining housing market you can bet they will tap into their savings which means less commissions for AMTD. The only area that I would be worried about is the possibility of a merger with E-Trade as I'm not really sure how that would effect the stock price. Otherwise I'm not a big fan of their service/product, thats why I switched to Interactive Brokers.

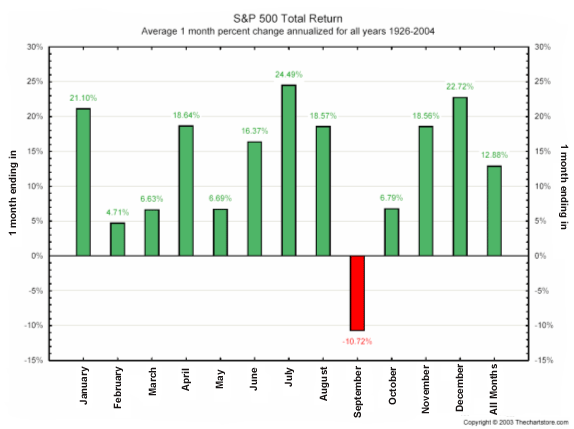
In other news, hooray for September, the only month to historically have negative returns on average.

Thursday, August 30, 2007

Tastey Charts for Carnivores and Honey Lovers

I realized today that bulls are herbivores. You know, their favorite snack is grass and so they generally don't have good taste in food. Bears on the other hand love their meat and aren't afraid of fighting off a few bees for a pound of honey.


Interesting Option Activity.
VIX/SDS Ratio Indicator.

Disclosure: I own CAT puts.

Tuesday, August 28, 2007

The 100th Post

It is my pleasure to bring you the centesimal post on Stock Geometry! Since the first post here on May 24th 2006, the other contributors and I have been calling em like we see em with a high success rate (AHM, CCRT, DDS, COF, JASO, OMR, DECK, CREE, LEND, etc). We haven't been right on them all but its the mistakes that we learn the most from. While this site was originally started with purely chart interpretation in mind, it has developed into more of a hybrid of fundamental and technical analysis which I believe to be the most profitable method. In honor of the occasion, I wanted to fill you in on some of the technicals and fundamentals of the site its self, here's some data on the last 6 months:


As you can see, the readership is still quite small but has been increasing even during the typically slow summer months. Currently, the biggest days for the site are when there is a link posted on yahoo finance or other blogs. Thats when we get the most attention, so thanks for spreading the word. Theres a bunch of interesting info in the pictures above and below for the web 2.0 nerd types like me, just click on the pictures to zoom in (as usual). Below you can see the geographic distribution of the readership:


I've got it broken down by city and country there. A few notable cities are Urbana, IL (where I live), Santa Barbara (where I use to live and betweenthebars lives now) and Aachen, Germany (where indigo-alien lives). We also seem to have some frequent readers in New York City, Louisville, Pleasanton and Vancouver. Those of you who we have not met, please introduce yourselves!

I think the three of us contributors agree that we get just as much out of the process of writing on this blog as we do reading each other's work. The idea here is to share thoughts on the market in hopes that we can learn from each other. There is no ulterior profit motive here, note the lack of advertisements, and I hope it stays that way. Fortunately, google provides this great blogspot service for free along with the service I used to generate the above data called google analytics. So a big thanks to google. I also wanted to take a moment to thank the other contributors, Ian (indigo) and Vince (btb) for making this such a fun and educational project to be apart of.

Going forward we don't have any big plans at the moment. I am pretty happy with the ways things have evolved with one small complaint, it would be great to see more feedback in the comments. Even if it is just a short note about a chart, some news that was overlooked or even a missspelled word, it is greatly appreciated. I'd really like for this to be more of a two way process between the bloggers and the readers. Thanks to all of those that have commented and I'm sure the number of comments will grow with the traffic.

If you are interested in keeping up on non-market related activities that we have going on , Indigo and I both have other blogs which you can find the links to on the right hand side of the page.

Ok well, congrats Stock Geometry on 100 posts! Now for the next 100! Thoughts?

Thursday, August 23, 2007

S&P 500 is more volatile than the Nasdaq?!

A new and unusual trend is developing with the nasdaq volatility index falling (VXN) below the S&P 500 volatility index (VIX) as seen in their ratio (see below) being less than one. Is this the beginning of a period in which we see more volatility in the larger cap industrials, I doubt it. More likely its just due to a recent repricing of risk in the financials which are a much larger component of the S&P. This is telling us that in general buying options on nasdaq stocks is cheaper and more attractive than on S&P stocks. Or conversely, selling options is more attractive on the S&P. Anyhow, this is a rare event historically and worth thinking about in my opinion.


Disclosure: I own QQQQ puts

Wednesday, August 22, 2007

Dollars looking for a home

I voted "No" in the recent StockGeometry poll on "the top of the market". As I wrote in this article, the markets are being force-fed money that has to be invested somewhere.

New proof of this can be seen in a Tuesday article published by Reuters. To quote the article;

"Experts are reassuring investors that U.S. money market mutual funds, which have gathered about $165 billion in new assets over an eight-week period..."

and,

"Money market mutual fund assets stood at a record $2.7 trillion on August 15..."

And given that billions more dollars have been injected to to the worldwide banking system, you just have to think that some sectors of the stock market will respond positively.

Hey, Budweiser still makes a lot of money brewing beer, and they don't seem to be having any difficulty raising funds by way of a bond offering. In fact, the size of that deal was raised from 350 million to 500 million, and I don't see where any other terms were changed. And all the usual suspects were lead brokers on the deal.

Rio Tinto recently posted quarterly earnings in the billion dollar range, and I'm sure they'll keep doing so. The company is always looking for acquisitions and in April they completed a deal on an Australian coal miner. The usual suspects are no doubt "standing on the sidelines" waiting for their next deal (now if the company would do something about their website).

And just to round things out, Johnson and Johnson still makes just about every product you really need in your bathroom and they make a profit doing it.

No, these are not sexy stocks. And it could be argued that many Blue Chips have been dead money for the last couple of years, but if you're looking to own quality, with no exposure to the sub-prime problem, I would argue that you could find many, many examples just like Johnson and Johnson.

Saturday, August 18, 2007

Another German Bank is involved

I've known about this investigation for about week. The Spiegal.de (spiegal = mirror) website made a solid reference to this situation on the 13th of August.

I have no idea how this will affect trading tomorrow.

To be honest, I suspect that this bit of information will be ignored, in the midst of the ongoing information storm.

Thursday, August 16, 2007

I'm not bearish on all stocks... [REDUX]

I didn't expect that move today, but then again if the market were that easy we'd all make money. And we all can't make money because who would we make it from? Anyways, the stocks I was buying today:


And JASO, I think it just needs to recover 30$ tomorrow after a breakdown/shakeout today. Frankly that stock was strong as hell today even as hedge funds dumped it. It was down as much as 9.1% but repeatedly returning to positive territory and was even up a few % at one point. Here's an updated chart:

Simple ABC Correction?


Well that was one hell of a day, what an awesome move for options expiration! So does that complete a simple ABC correction? All major indexes have pulled back >10% and there was a huge bullish reversal today on record high volume, note the hammer candlestick. I have included Fibonacci values for the moves in SPY and DIA as possible areas of resistance/support. My personal feeling is that this is the bulls last stand but we'll have to see what they can muster up. I'll be very surprised if they can turn this thing around and will be looking to re-enter shorts at the top of the B move or lower if necessary. Perhaps the 38.2% pullback on this move. For now however, I am long JASO and ICE. And if that was a simple ABC correction, then we are now supposed to resume the bull market and make new highs. I think this is more likely the 1,2 & 3 of a 5 impulse Elliot wave (since I think we just started a bear market based on fundamentals). Any thoughts?

Tuesday, August 14, 2007

I'm not bearish on all stocks...


The two sectors that make the most sense to me fundamentally are international growth areas like China and energy related issues (which are international typically). Combine these two sectors together and what do you get? JA Solar (ticker: JASO), a Chinese solar cell company that did an IPO about 7 months ago. This is a stock that I highlighted back at the beginning of the summer when it was 24, that was before it doubled and has now pulled back. Well I still like it, and it is still in a strong uptrend. Furthermore, earnings were great and an analyst upgraded the stock last week following the numbers.

Disclosure: I own JASO calls

Monday, August 13, 2007

Stock Geometry Readers Call THE Top

Tonight the poll ended with 44% of voters choosing that yes, the bull market is over. The exact results are below with the second most popular choice being that this is a short term top, 10% correction. I have to say that now, after all that has transpired in the last few weeks, it isn't surprising that most people call "a top" since we did get a big decline. But in fairness, the results have only changed marginally since the poll began three weeks ago.


I should note however, only 25 people voted in the poll which was a pretty small sample space. I checked on google analytics, a neat free service that tracks all the traffic at the site (yeah I just said "neat"), and it showed 300 unique visitors during the three week poll with 588 total visits and 972 pageviews. In other words, less than 10% of the readers voted. Well now we have something to improve upon, this was the first poll after all.

Anyways, I just wanted to get it on record that you had predicted THE top in the stock market. We won't know that this is a bear market until after we are knee deep in it, but where is the fun in calling it then? Only time will tell, and we'll be watching.