Sunday, August 27, 2006

Major Money Outflows in GRMN and CME

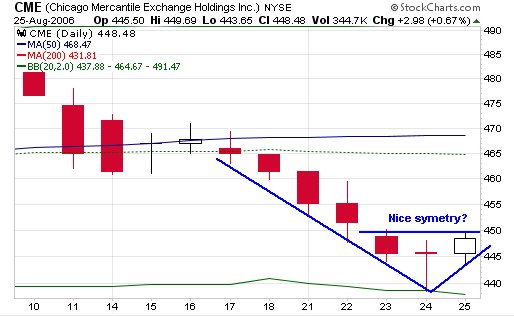
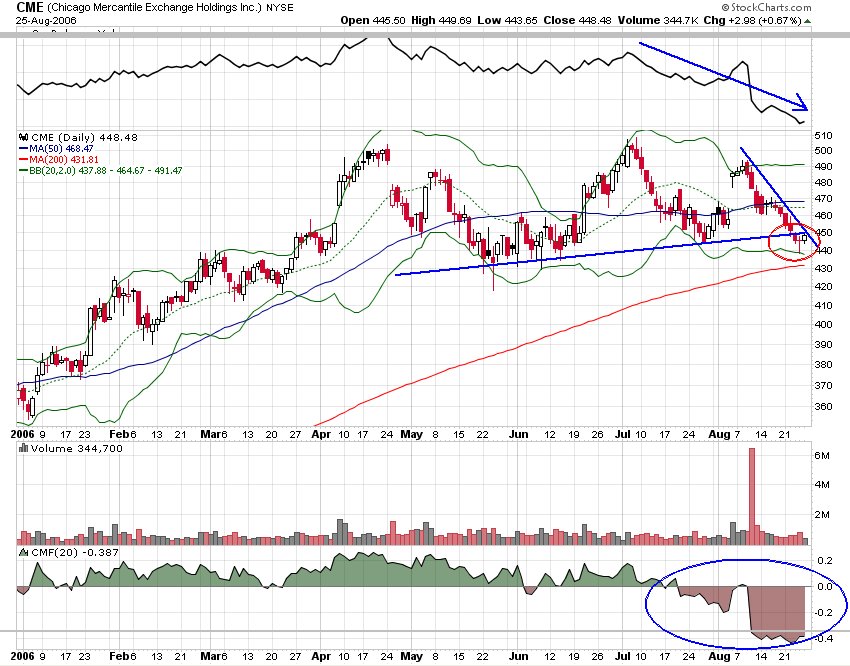
Note that while CME has broken support and big money has clearly been dumping it lately, the candlesticks alone suggest a reversal on the daily. If I were ignorant of the volume action in CME I would say buy it for a swing trade. I suspect the action early monday morning will set the standard for the week.
*You can always click an image to enlarge.

Sunday, August 20, 2006

Breakout!

Stocks defied all odds last week and broke out of a 4 month long downtrend led by strength in the nasdaq. The lower volume aside, it sure APEARS as though the broader markets wil at least re-test the highs. The rally was more or less based on investor optimisim derived from the perception of a "soft landing" for the economy as opposed to a full blown recession. As sure as everyone seemed to be that the markets would turn lower last week after a selloff on the fed pause, the nasdaq broke it's 50 dma and a downsloping trendline:
Right now, we have a major breakout on lower volume in a slowing economy. The chart says we go higher and so I would recomend looking for breakouts on individual stocks. Some that I will be following early next week will be LMS, FMD, TNL, GRMN, NITE, DRIV, TRMB, ISE & ICE. Yes that is a long list but there are alot of nice charts right now. As a technical trader I have to look for long set ups in this market, but I will be quick to sell as fundamentally we should break the last few weeks lows in a slowing economy. It may be smart to either hold a large amount cash or hedge your long positions as this breakout could easily fail and reverse. As a possible hedge you might ant to look into VIX (volatility index) calls, this is a bet on a major market decline. Also, histoically the VIX has not been much lower than the levels is at now(which suggests we may be on the cusp of a major decline).

Sunday, August 06, 2006

Broad Market Decline Coming

I see the market averages at a very important pivot point right now with a high downward bias. We have seen strong opens get sold and lower volume on the days when the market closes up, strong indications that institutions are pulling money out of the market. The nasdaq tracking QQQQ have been in a severe decline ever since breaking down in early May. The S & P 500 tracking etf SPY looks a little better but is at strong resistance right now (below).
What does this mean? For one thing I would be very careful on the long side and preffer shorts. Staying out of the market entirely may be a good idea until new direction is found. Many would argue that when/if the fed pauses in their interest rate hike campaign the market will rally, but I would say that it is just plain stupid if the market rallies because the economy is doing so poorly that the fed has to stop tightening. If there is a pop I would be shorting into it and I bet many pro's would too. For that reason I suspect a fed pause to be just another case of buy the rumor sell the news. But this time sell the news then sell with both fists because we are headed into a economic slowdown.

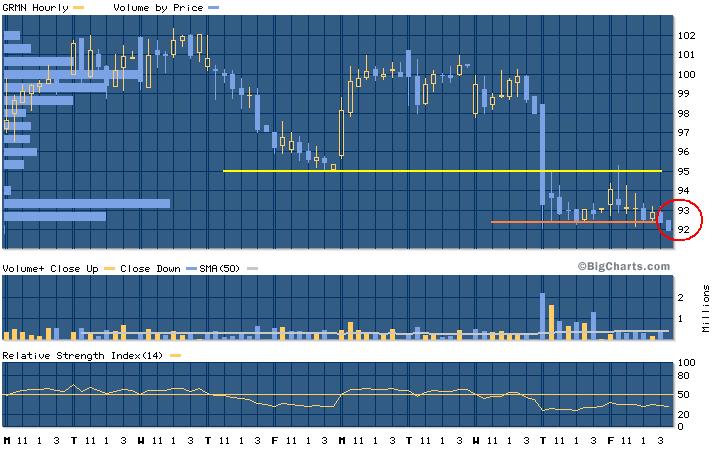
GRMN behaved true to form an sold off all day friday until finding support at 85 at which time i exited my put position (at a nice profit). Then after rallying about 1.5 points they announced a 1.5M share buyback(on 110M shares outstanding which is nothing even when compared with the 1.9M daily average volume) and the stock ran into the close. My personal opinion is that this will present a great shorting opportunity next week when the stock tops out short of 100 (again). AS I said before the GRMN chart reminds me of HOM (now HSOA) just before it craterted 50%. More on GRMN later...

I like IOTN and MOVI long for earnings this week. They do not trade with the market. Happy trading!

Wednesday, August 02, 2006

The GRMN Party is Over

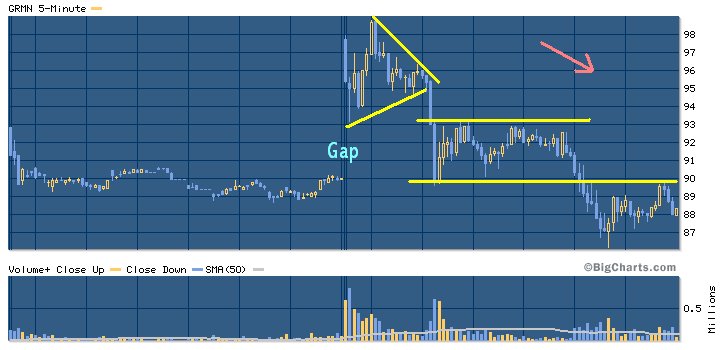
On blowout earnings GRMN gapped higher this morning reaching as high as 105 in the premarket. But as soon as the market opened the selling began in volume and did not abate. GRMN turned out to be a good trading stock with substantial moves all day long but the trend was decisively down. Having bounced twice off the closed gap at 90 GRMN broke that in the late afternoon touching 86 and closing near 88. I will not speculate on reasons for this aggressive distribution I will however speculate that GRMN goes alot lower from here, 80 is still the first target. Here is an hourly 10-day chart to keep the recent action into perspective, note the money flow and engulfing nature of today's trade.

For those interested in options here is today's data for one of the options I traded (aside from selling calls this was the most profitable way to trade the action):

GRMN Aug 2006 $95.00 put (GQRTS)

Last Trade: 8.50
Date: Aug 2
Prev Close: 8.50
Open: 3.20
Bid: 8.50
Ask: 8.90
Day's Range: 2.50 - 10.20
Contract Range: 2.40 - 9.30
Volume: 3,628
Open Interest: 2,088
Strike: 95.00
Expire Date: 18-Aug-06

Disclosure: I currently hold August 90 puts and may purchase some 85's tomorrow.

Monday, July 31, 2006

GRMN in focus

As a followup to last week's post about the weakening of GRMN I would like to focus on the GPS technology company this week for earnings wednesday. Last week I said that I expected the stock to head lower after it closed out the previous week just below it's 50 dma which had been compromised twice recently. Well the stock bounced monday and looked to head higher off of the 50 dma, but check out what happened next, and especially note the action thursday and friday:

Of course it is important to be aware of the context. GRMN announced a new GPS plane navigation system last weekend which justified monday's bounce then we had major rallies in the broader markets albiet on lower volume. Nonetheless GRMN took a beating after trying to lead like it has been. They post earnings on wednesday morning (11am ET) and I see two factors that could be driving the heavy selling going on in GRMN. The first would be a general fear that GRMN may dissapoint even slightly and get punished like other would be leaders RACK and SWIR on friday. The second is genuine smart money selling ahead of a bad report. Either way (or perhaps others) it will be very interesting to watch GRMN next week and see if the technicals correctly predict a plumit wednesday.

Lets take a quick look at a longer term chart to see how far it can fall in the event of the catastophe I see coming in the chart:I see the first stop at 80 but with a really nasty break GRMN could spend some time in the 60's. I will post updates on GRMN's progress this week. Cheers!

Sunday, July 23, 2006

Double top in CME, Pullback in CVX and Cracks forming in GRMN

Getting back from vacation I was not surprised to see many ugly charts. Investors are becoming more aware of a global economic slowdown that doesn't exclude the US coinciding with a panic over the middle east and stocks are being punished. Many stocks are broken, having been heavily sold and now the only ones left to fall substantially are the fund favorites. While one might think a bounce should be here soon and that the markets are "oversold" almost everything I see says sell. I noticed a potential double top in best of breed name CME.
CME closed below its 50 dma with an ugly low of the day close friday. However, support is just below at 440 which is a good short term target. Then after some consolidation I would expect CME to head to 380. Recall it was an earnings dissapointment that led to the first failure at 500. CME posts earnings on Tuesday.

CVX has been outperforming the market on the rise in oil prices and acheived a new high early last week on the recent push. Compare CVX to XOM or the oil service etf OIH and you will see just how strong CVX has been. However, the recent rise has been unchecked and this blue chip is due for a pullback. Fibonacci retracements have worked in the past for CVX so I would target somewhere in the range of 60-61 before the next leg higher.

I especially like CVX longer term because I would expect funds who are not allowed to hold lots of cash to rotate money out of less conservative stocks and into high dividend blue chips and there isn't one better than CVX. You can expect to see more on CVX here in the future.

Another popular stock that has been highled for months in the IBD 100 is GRMN. I do not know much about the business of GPS devices but I know the stock has been weakening lately. There seems to be alot of resistance above 100 and has dipped as low as 80 recently. Now may be a good time to jump in for a quick ride to this area potentially targeting the 60's if 80 can be breached. On Friday GRMN closed just below its 50 dma and I would expect this one to head lower.


I will try and do updates on previous picks in the comming weeks and get back into posting at least weekly. Enjoy!

-pyth

Thursday, June 22, 2006

Has GME's time come and gone?

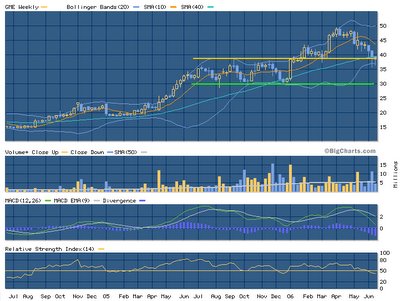
GME's stock has been a favorite of wall street for a few years now after they aquired their main competitor electronic games boutique (EB). It has had a decent run and hit a high at 50 recently. Take a look at this two year weekly chart, notice a previous price channel:GME is the dominant player in the brick and morter video game retail industry and sells through gamestop and EB locations. The video game industry has been growing steadily over the years with the success of the playstation 2 and xbox and is likely to grow further with new systems comming out this christmas. Many have wondered not if, but when video games will begin being sold and downloaded online. When this transition occurs the brick and morters who are not ready will be hit hard no unlike the bankrupt musicland and distrubuters like Navarre. Nintendo recently announced their new wii system will be able to download games from any previous system online directly from them for 5-10$ a pop. This is bad news for gamestop because not only will it hurt sales of new games, but the re-sell portion of their business should also hurt. Many will say that nintendo is a smaller player, but they are quickly taking market share away from the competitors and the new portable nintendo DS is becoming a pop icon like the ipod. This is purely speculation but I suspect the era of game downloading to home systems will begin as early as next year. This is certainly a gradual change and not abrupt, but from a trading standpoint the top where funds and the stret begin to dump is lucrative. Also this could potentially be a very long term short given the horizons. Take a look at this 6 month daily chart:

From a technical standpoint the stock has been taking on water ever since it touched its 50 on a few gap an runs. This follows the 6 months of channeling leading to the breakout. Since the decline began GME has followed a trendline down with the lower BB through support around 38 and through both moving averages (50 and 200 dma). This has occured on increasing volume and I suspect that institutions are begining to take profits on GME. The ideal entry would be at 38 or higher with an initial target around 33 where a gap becomes closed from there GME may trade in the old range for an indefinate period of time before the big collapse. I suspect when all is said and done this decline will look alot like MOVI's.

There are alot of factors to keep in mind. The new nintendo DS lite is selling out like crazy right now along with the games. But I suspect this may hurt GME because the system only sells for 130$ so if it is being bought instead of the PSP at 250$ or xbox live at 500$ then GME may miss out on some profit. GME apears to be aware of this and is trying to make up for the cheaper system by selling in house accessories and system bundles. Also nintendo's new system wii coming out this christmas will be much cheaper than the competition. Again this is just speculation but I think nintendo is going to come out way ahead in all this stealing market share from it's competitors with innovative ideas like touch screens and motion interactive games, not to mention much lower costs.

I will follow this one for a while as I suspect there may be alot of downside comming for GME. There will be more later as the situation develops. For now go try out the new nintendo DS and ask yourself if nintendo is once again about to rule the world.

More here.

NOTE: I will be on vacation for the next two weeks so there won't be much if any posting during this time. The other members may post if they want. I will be back online in the swing of things mid july. My current holdings are long: IOTN, MOVI, HOM, short: GME. Have a great summer!

Sunday, June 11, 2006

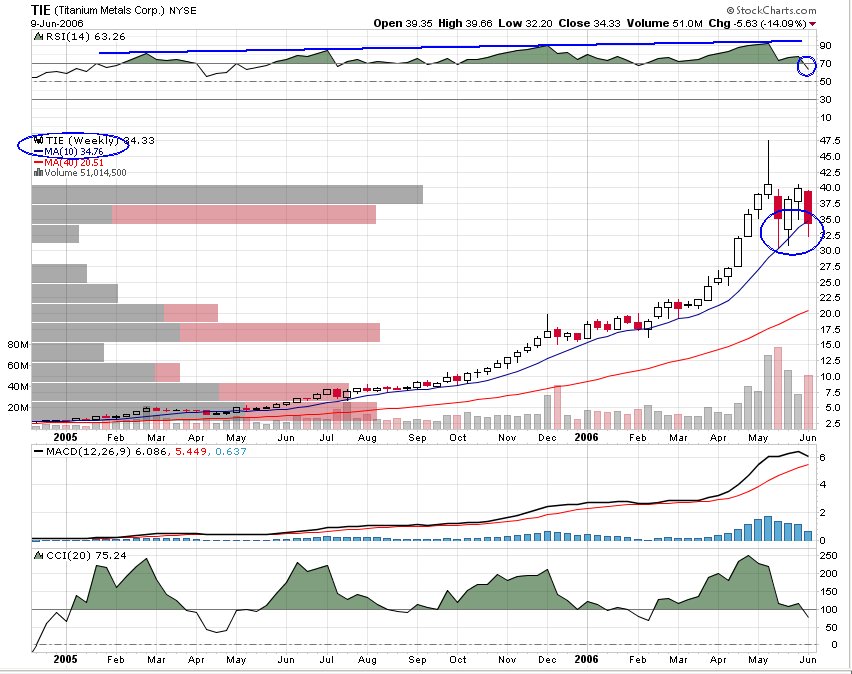
Is this TIE gonna get shot down?

Shorting this stock might make you feel like Han Solo with a ticker like TIE. The titanium producer primarily sells to companies like Boeing who use the strong and lightweight metal for aerospace. If Boeing was building tie fighters they would certainly use titanium for the frame.
The stock has pulled back considerably from it's highs about a month ago when the stock split, but its still holding above it's 50 dma after a few bounces and a pierce last thursday. Compared with any other mining stock this is a considerable feat. Last week I had been buying puts looking for a big drop when it broke it's 50 dma for the first time. It broke it's 50 dma on thursday only to reverse intraday on high volume and close alomst breakeven. This was the stock's chance to reverse and head higher, however Friday much of this effort was negated when TIE closed almost at its daily low down 5%. It has now formed a slightly widening down channel on the daily and I think its ready to re-test the 30$ low monday or tuesday. The support there won't be as strong this time because last time it was there the 50 dma was just above 30. Also note there is alot of room to fall once the 50 dma is breached and 30 is broken (forming an ABC continuation pattern). Furthermore, on the weekly chart TIE actually did close just below it's 10 week average (~50 dma) for the first time since this parabolic move began over one year ago.
I think the fundamentals are on your side too because metal prices are declining after a couple year parabolic, speculation induced move (especially in Ti). Furthermore, Russia is producing more and more Titanium and recently signed a major 18B$ deal with Boeing to sell them Titanium. I'm not sure how much market this will take away from TIE, but it can't be good for them. In addition, TIE trades at more than twice it's peers valuations.

TIE's PE: 38
ATI's PE: 14

I also thought the recent activity of these Japanese Titanium companies was interesting, but I'm not sure how good of an indicator this actually is. They have been getting hit hard as of late and now lie well below their 50 and 200 dma's.

I'm sure you can find more reasons why TIE should fall, like BA's poor performance recently.
My only concern is that we have options expiration this friday and TIE has one of the highest implied volatilities out there. It is certainly a very good canidate for a max pain pin because of the large interest in selling TIE options. Max pain currently lies at about 30 but as I learned last month it can change rapidly as the option volumes spike towards the end of the week. By the look of the chart I would guess there will be more of a tendency towards 32.50 or 35 due to options but clearly this stock wants to go down and it may be impractical for the option writers to try and hold it up here.

The Market Observations blogger has nailed the TIE short in the past. He literally called the top and got me looking at TIE to begin with about a month ago. After some consolidation he is bearish on TIE once again.

This article on titanium process technology might be worth a look. Aparently a new company out of MIT has a way to cut the costs of titanium processing from about 40$ to 3$ per pound.

Wednesday, June 07, 2006

DAKT Top?

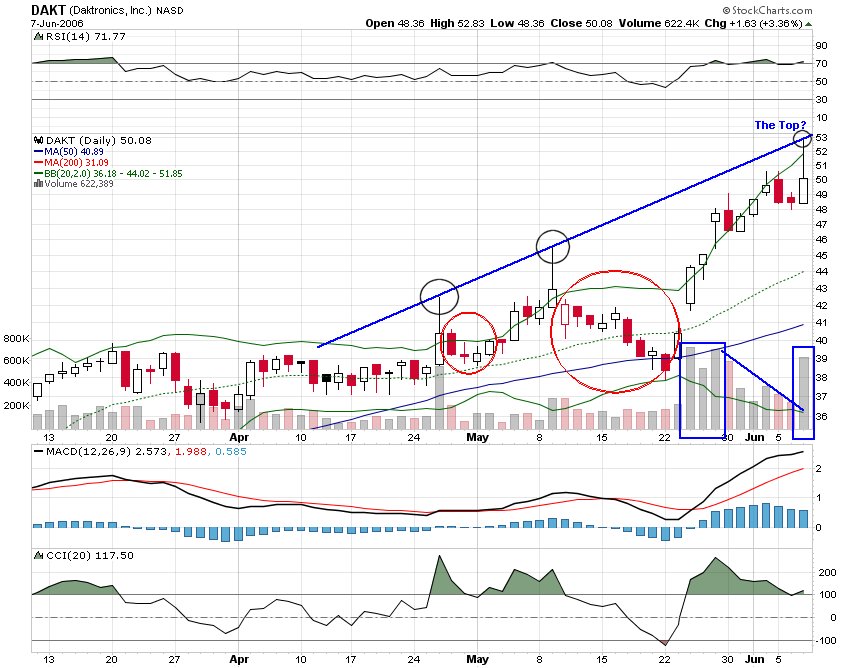
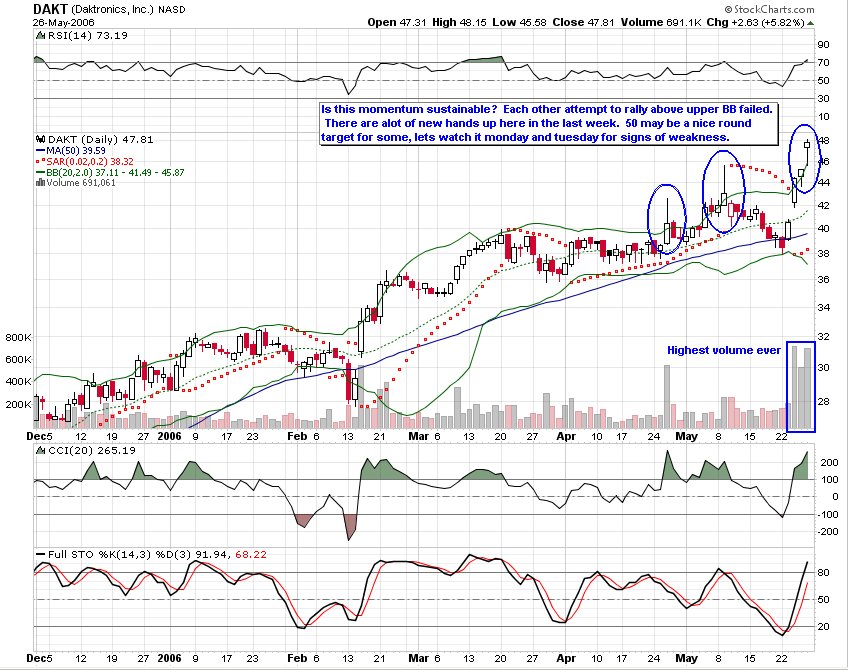
For aggressive traders DAKT appears to be ready for at least a short term decline. Today it formed a long tail on very high volume that matches with previous tails. I think this should be good for a short term drop down to at least 48, maybe 47.Depending on how it behaves it's self there could potentially be a very large decline as it DAKT could be forming a long term top with such heavy volume in this 52-week high territory. Its certainly worth keeping an eye on. I have no position currently but will prob try and short it for a one-two day trade. Note, this stock is the strongest stock (not too many bearish indicators) I have mentioned as a possible short since this sites inception and it is the most risky. However, I have found the first few drops in a reversal to be the most profitable if they can be timed correctly and I smell a reversal comming in DAKT.

As an update to previous posts, I am now out of DRIV but I think it will fall further. See the HOM comments for how my position progressed there. I have added MOVI Sept 7.50 calls and I now have a fairly decent position in TIE puts, see my market vibration post for more info.

Sunday, June 04, 2006

A Perfectly Bearish Top in HOM

Take a look at this HOM chart and put yourself in the shoes of any holder. Fundamentals aside can you find any reason to buy/hold this stock. Some found one thursday when it bounced off it's 50 dma "like a rubber ball." But those buyers were punished friday with bearish engulfing on the highest volume ever. This comes after a perfect shooting star top formed just over a week ago to end the parabolic rise in HOM's price. Other indicators are pointing down, like the negative divergence in the RSI, CCI that just crossed zero and a double top in the MACD.
Caution is waranted, HOM is a hurricane play. Aside from ZENX (imo), HOM was (and may be in the future) the strongest hurricane play. Last year they reaped huge profits on rebuilding the South in the wake of Rita and Katrina. Another disasterous hurricane and HOM could pop. But it seems to me the stock has already made its move in anticipation of a strong hurricane season nearly tripling in price in six months. The stock's weakness friday is strongly correlated with a very negative report by the folks at Stock Lemon. Find it here. If any reader can find a more bearish chart I'd like to see it.

Disclosure: I bought June 10$ puts at the close Friday.

Saturday, June 03, 2006

MOVI is on the move

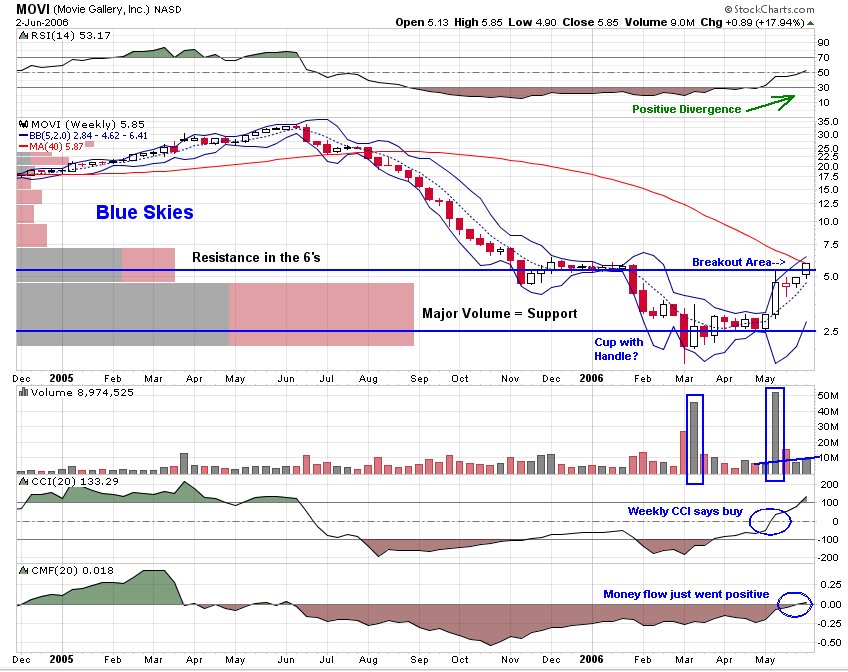
Ok, hoky title for my first article but it is true. After a 2005 that left bagholders reeling, MOVI turned in first quarter 2006 earnings that reversed the long slide. That long slide started in the 30's, only to finish in the single digits.


Driving this slide were concerns over the companys ability to pay down the debt load it took on in order to finance the takeover of a competitor, the Hollywood chain of video rental outlets. In fact, by early this year there were serious fears in the market of bankruptcy, while the company continued to under-perform financially.

In the mean time management has gotten religious about cost controls and the stock price situation turned around with the release of first quarter 2006 earnings on May 11. Let's take a closer look.


Basher types trained in technical analysis (fortunately, there aren't many of them) will see a glaring gap in the daily chart that will most certainly be filled and we must be prepared for that. In comparing the weekly and daily I see a penant that touched the upper BB on Friday, on both charts strangely enough. Resistance could be provided by the 200dma that is just entering the picture on the daily chart, at $6.48. Confirmation to that resistance level is shown by the Price by Volume overlay in the weekly chart. There is a second large group of bagholders at this level who must be satisfied before we go forward. However, I believe we are looking at blue-sky time after that.

How long will this take? Well, I don't know. But I believe we'll see a resolution to this whole situation with the second quarter earnings which should be presented sometime in August.

In terms of fundamentals and projections, I took the time to put together a spreadsheet.

(click to enlarge)

Wednesday, May 31, 2006

DRIV is Cracking

DRIV apears to be in the early stages of a breakdown. It closed below it's 50 dma for the first time in about 4 months yesterday then broke out of its recent range today. The RSI is confirming an end to the uptrend, CCI is decidedly bearish and the MACD is about to go under. There may be a few more days of stalling in the lower end of it's recent range before making the first major leg down. As you can see from the chart there is alot of room to fall with no major consolidations in the last run up. A good target is the 68% fib retracement which lies near a high volume move and the 200 dma around 36. DRIV is currently IBD's # 41, lets see how far it falls in next monday's paper.
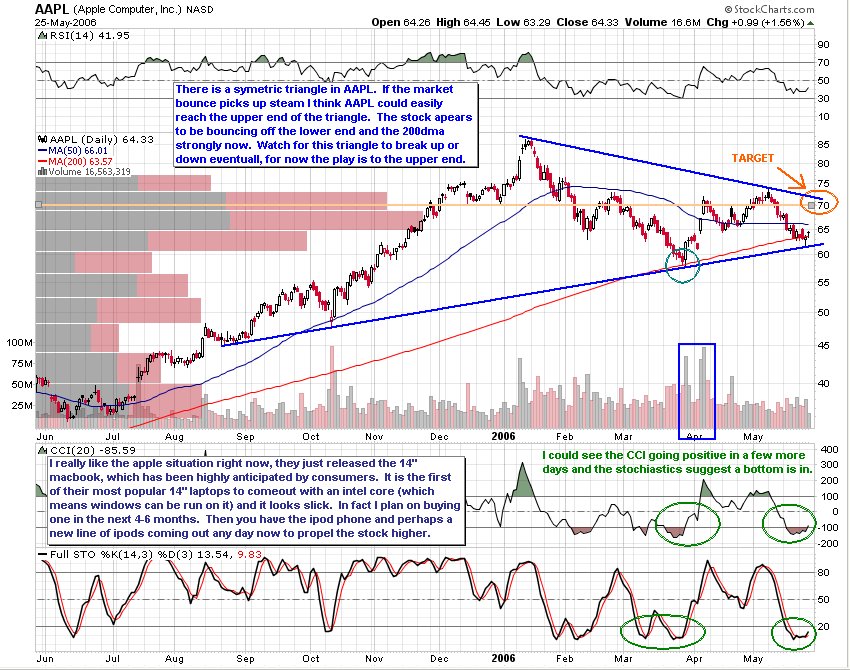
By the way, I am out of AAPL completely after the breakdown today and yesterday. It failed to hold at the lower end of the symetrical triangle I mentioned before and apeared poised to break 60 (which it did) so I am out. There is a potential double bottom forming, but I am staying away from this one until it can show more strength and regain it's 200dma. If it breaks last month's low I could even go short.

Tuesday, May 30, 2006

Climax tops and SUPX

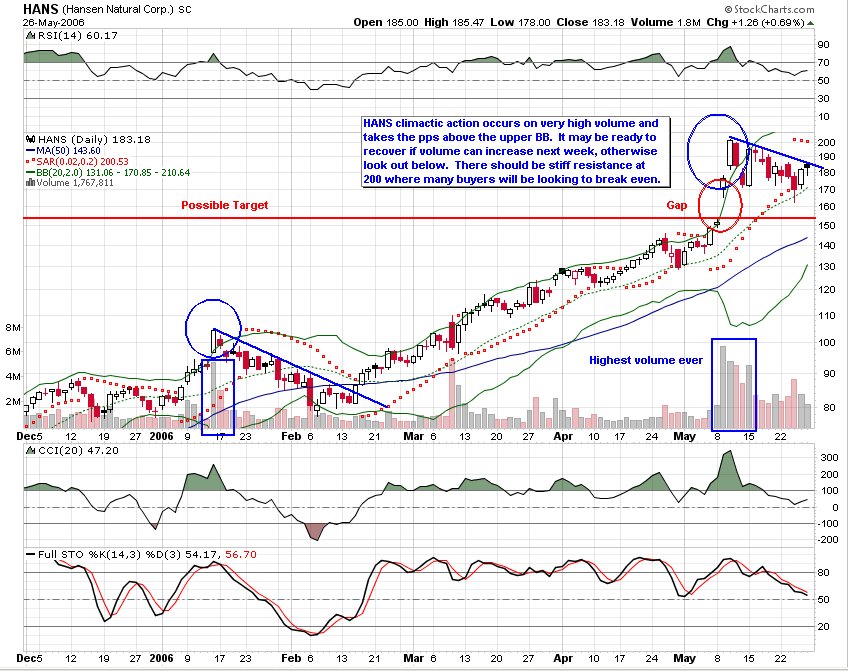
The high at 200 HANS put in a few weeks ago would have been a great place to go short. The high occured on the highest volume ever, a massive increase over the average. The move took it above it's upper BB before is topped out around the nice round 200$ level. There may be more downside, with possibly a gap fill if the volume doesn't pick up on the upside. The reward is limited here and was intended to me more of an example of a climactic action. From 200 to the upper end of the lower gap on the climax action there was over a 15% drop.
There is a similar type of action in DAKT occuring now. The stock has vaulted above the upper BB on the highest volume days the stock has ever had. The last two times it tried this recently the stock sold off hard intra-day leaving the long tails circled in the chart. The current move looks like it could take DAKT to around 50, a nice round number for a top. If DAKT moved to the upper end of the first gap in this move (around 41) it would be just over 15% gain. Worth note was that DAKT announced a 2:1 split last thursday and may have contributed to the buying frenzy at the end of the week. I read this in an Oneil's book over the weekend: "It is also helpful (to the shorts) if a stock has recently split... The second time a stock splits is usually at a much later stage in the stocks overall move. This is normally too obvious to the crowd to be a rewarding stituation... Like everything else in the stock market it is a simple issue of supply and demand with a large potential supplyof stock that could be offered for sale in the market place."
SUPX jumped out at me in a scan of the IBD 100. It was 76 last week, is now 97 and apears to be comming off for good unless is can shake off some recent sellers. After filling a huge gap down on the biggest volume ever the stock failed to move higher and broke out of its channel up to that point. It now appears to be pausing before the next major leg down.

Also, I still think AAPL is set up to run up to the upper end of the triangle mentioned last week. I added calls on friday.

Saturday, May 27, 2006

The S&P 500 SPDR is bouncing off it's 200 dma

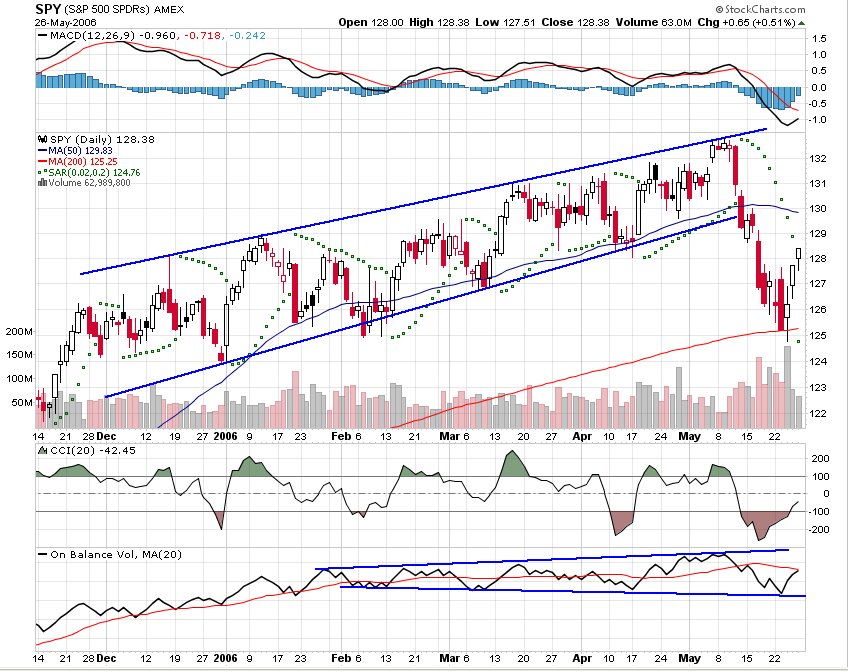
Kudos to Dan for nailing this bottom in the Spider ETF that tracks the S&P 500 last week. Clearly the bounce still has upside momentum and should continue for at least a few more points, notice it closed at the high friday. Since the breakdown out of the rising channel it had been in occured with significant volume it sould be taken as a serious break in the chart. This bounce would then constitute a throwback back up to the breakdown point and resistance around the 50 dma. However, it is possible for the throwback to go as high as the previous high made, forming a double top. But it would encouter significant reistance on the way, and I would not expect it to make it that far. Notice the broadening wedge forming in the on balance volume, things may really start to get ugly when the OBV fails to make a new high and begins to break down. I think the market is shaping up for a perfect shorting opportunity when this bounce runs out of steam in the next few weeks. Right now I am looking for solid compnaies bouncing off their 200 dma for longs (like AAPL) and not so solid companies about to reach their 50 dma, or worse, for shorts (like PLCE). Dan may provide us with futher insight into the SPY next week.

Friday, May 26, 2006

Symetric Triangle in AAPL

There is a long term symetric triangle in AAPL. The stock recently bounced off the lower end and the 200 dma, it is poised to reach the upper end around 70 soon. I got into this one today with some AAPL June 67.50 calls and will be looking at getting some June 65's tomorrow as well. There are more details about my reasoning in the chart below. Click on it and zoom in to read my comments.


Also, check out the link on the right hand side of the page to "Market Observations." I agree with the author about GOOG being good for a quick bounce trade. It seems to have found support at 360, the upper end of a gap zone, and is poised to head higher, perhaps the mid 400's is achievable. I like the 390 calls because the premium isn't that bad considering it's GOOG. The stock has been in a 10 day period of decreased volatility which may change very quickly if it breaks 385 and runs. In otherwords the implied volatilty may increase on those June calls and you can make money on that as well as the stock appreciation. A word of caution, there is some resistance at 390 and the 50 dma lies there. I would target 400-410 on this trade and don't expect 390 to present too much troublle if the market agrees.

Wednesday, May 24, 2006

Welcome to Stock Geometry!

I've created this blog mostly as a venue for me to store charts. I find myself emailing charts all the time and figured I might as well just upload them to one place and just give out a web address. Initially this will be a weekly updated site, with my picks for the week being posted on Sundays. Please let me know what you think, input is always welcome.

This week's picks were ICE short, and RACK long. Please note that I picked these last Sunday, so the charts are no longer current. But I think they are useful nontheless.

ICE has already collapsed down to my target around 55, unfortunately I missed the ride. SIlly me. I am now long at 54.30 looking for the right shoulder of a head and shoulders top. Notice how it closed today(not on this chart) right at support, I think it is a good short term long. My target on the long is the 50 dma.


I bought RACK calls at the open monday and sold them yesterday for a quick 40% profit. It's direction from here is unclear to me.


This CME chart may be of interest, it apears to have the most room to fall of all the broker/dealers. If ICE is any indicator of CME's future this may be a great short. I see a long term top, maybe a slanted head and shoulders on this one. Note, it is halfway to my 400$ target.